Xcoins™ Official

xcoins
moon

bitcoin halving 2024 download status bar
March 28, 2024

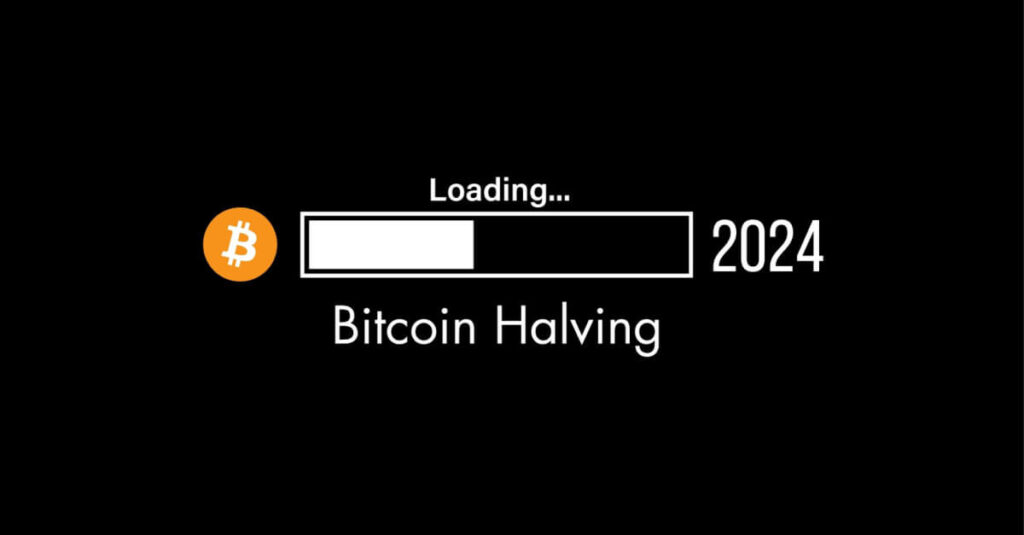
Bitcoin Halving 2024: What to Expect

March 28, 2024

Bitcoin has captivated the attention of investors and technology enthusiasts since its inception in 2009. With its limited supply and the unique process of halving, Bitcoin has set itself apart from traditional fiat currencies. 

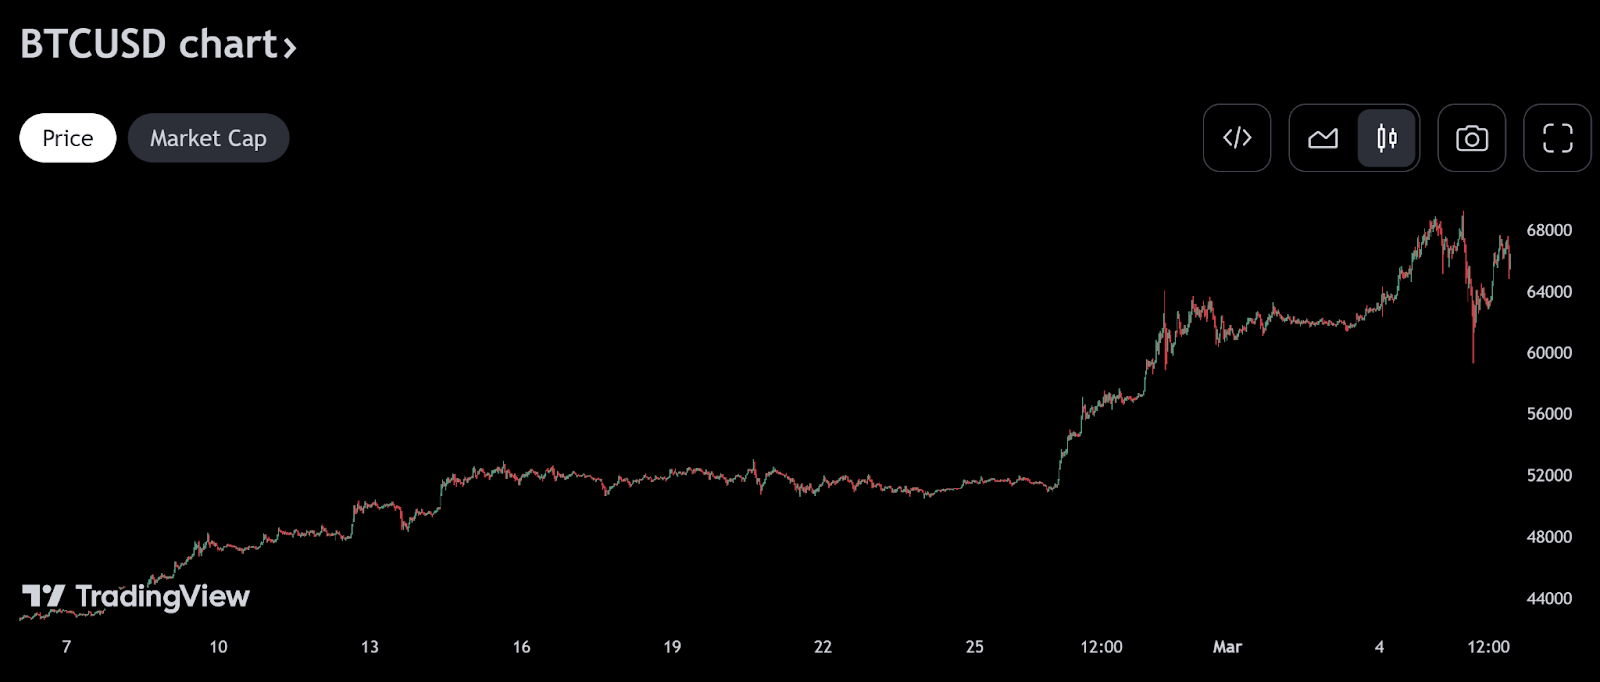
As we approach the next halving event expected on 19 April 2024, it is crucial to explore the impact of halvings on the cryptocurrency ecosystem and understand the potential opportunities that arise from buying Bitcoin before the halving. 

In this article, we will delve into the significance of Bitcoin halvings, examine historical patterns, and highlight the buying opportunity presented by this upcoming event.

Understanding Bitcoin Halving

Bitcoin halving is a fundamental aspect of the cryptocurrency’s monetary policy. Approximately every four years, the reward for mining new bitcoins is halved. This deliberate reduction in the creation rate of new bitcoins helps control inflation and maintain a predictable supply. By mimicking the scarcity of rare commodities, Bitcoin’s halving events create a sense of rarity and potential value appreciation over time.

During a halving, the reward for mining new bitcoins is cut in half. This means that miners receive fewer bitcoins for their computational efforts. The reduction in mining rewards serves the purpose of controlling the rate at which new bitcoins are introduced into circulation. With a limited supply of 21 million coins, the halving mechanism ensures that the creation of new bitcoins slows down over time. This deflationary nature sets Bitcoin apart from traditional fiat currencies, which can be subject to unpredictable inflation due to the discretion of central banks.

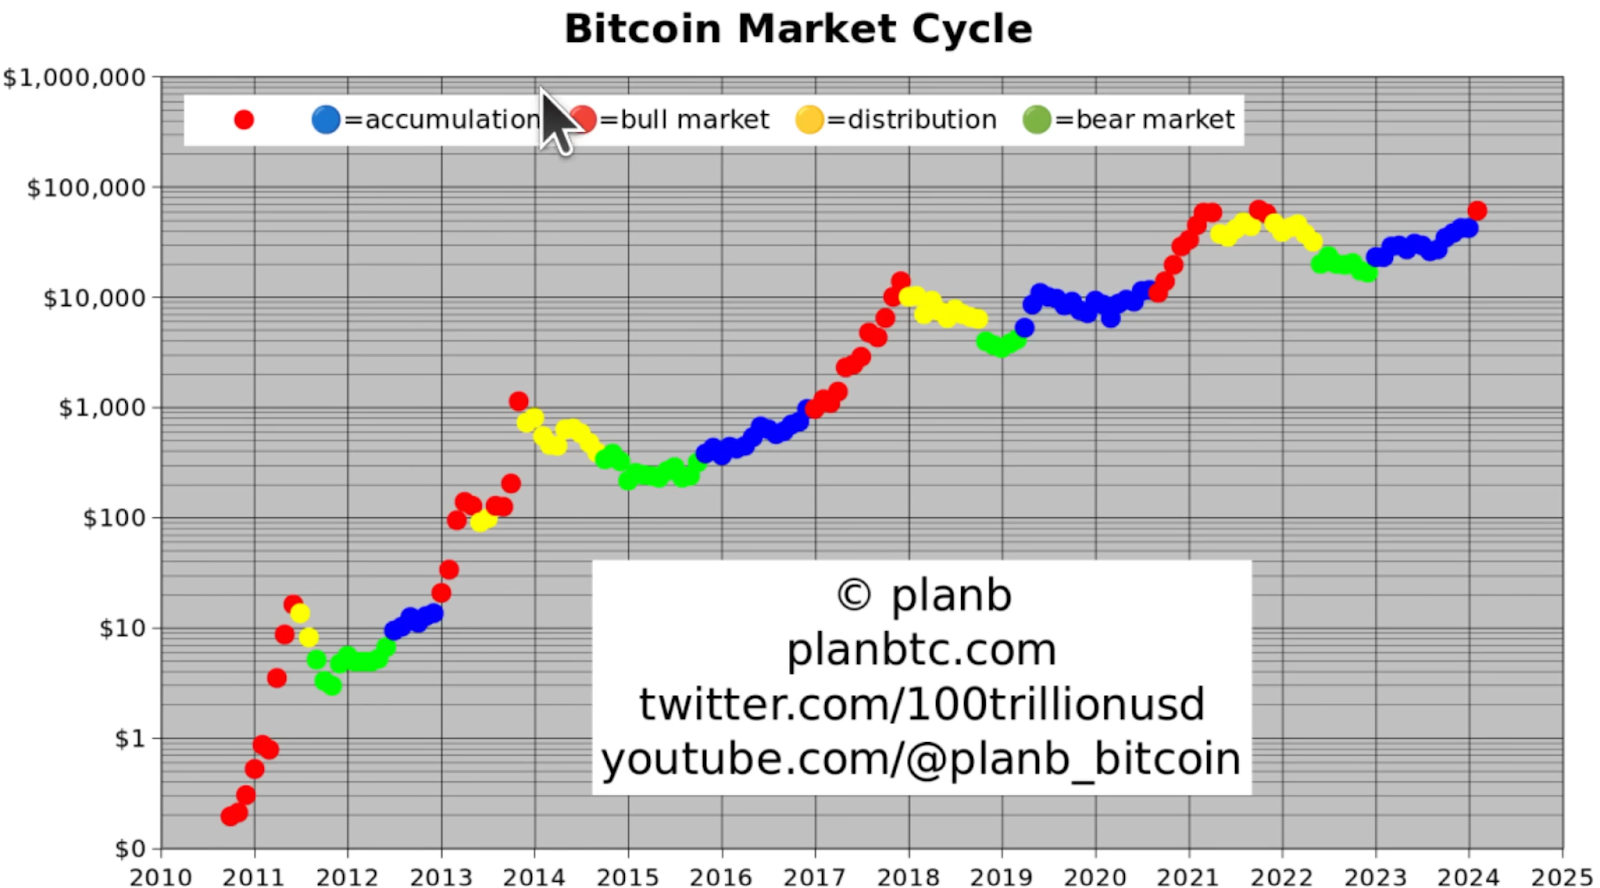
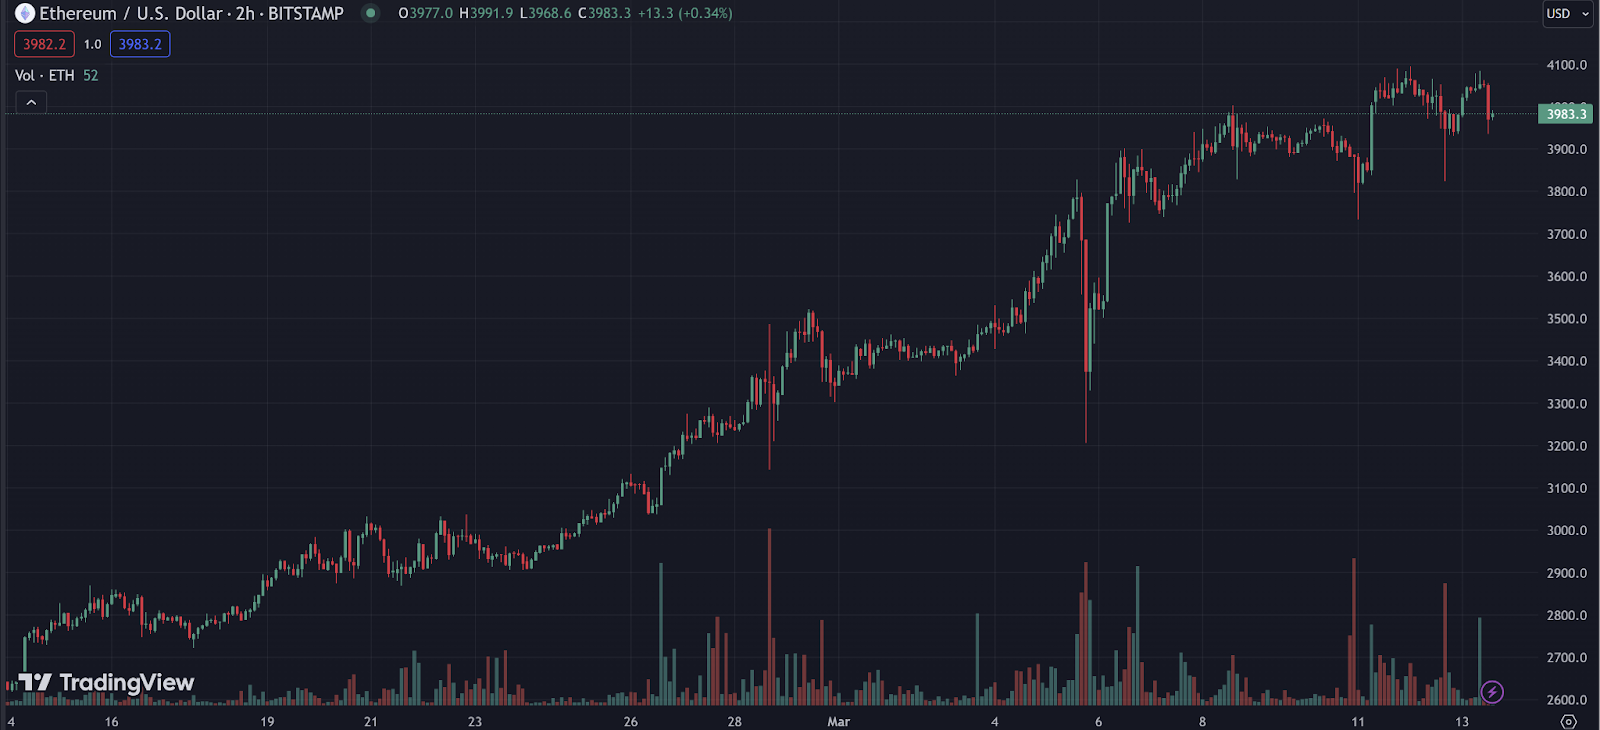
Historical Patterns and Price Action

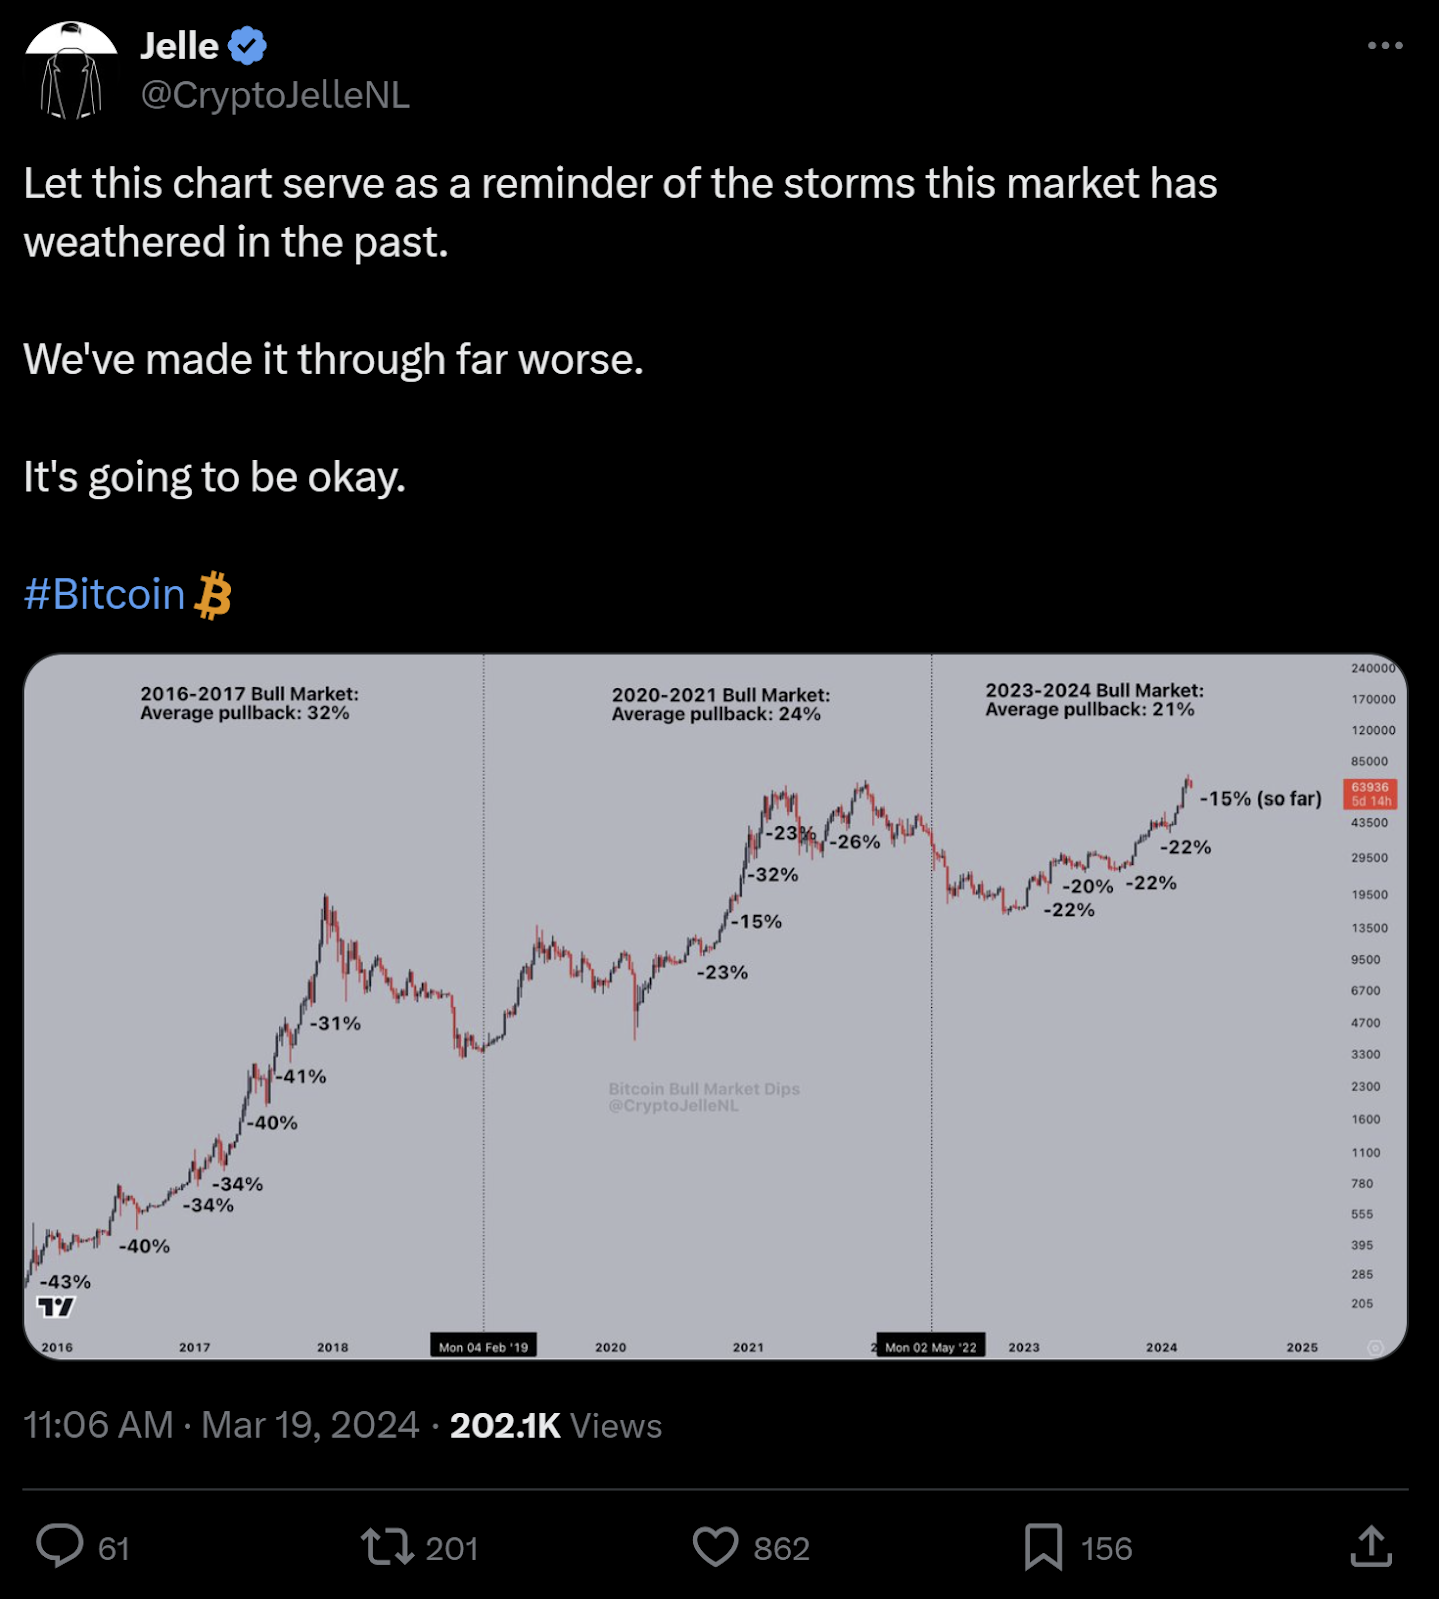
Historical data indicate a consistent trend in Bitcoin’s price following each halving event. Past performance is not indicative of future results, but it provides valuable insights. In previous halvings, Bitcoin’s price has shown an upward trajectory in the months that follow. While it may seem counterintuitive in an efficient market, where events are anticipated and priced in, several factors explain this behavior.

The scarcity factor plays a significant role in Bitcoin’s price appreciation following a halving. As the creation rate of new bitcoins decreases, the existing supply becomes scarcer. This scarcity, coupled with increasing demand, can lead to a rise in Bitcoin’s value. The limited supply and the anticipation of reduced future supply create an environment where the demand for Bitcoin may outpace its availability, driving the price upwards.

Furthermore, halvings introduce a level of predictability and anticipation within the Bitcoin ecosystem. The event is widely known and followed by the cryptocurrency community, leading to increased attention and speculation. This heightened interest and speculation can contribute to price movements as investors and traders adjust their strategies based on the upcoming halving. The combination of scarcity and market dynamics during halvings creates an environment that has historically favored price appreciation for Bitcoin.

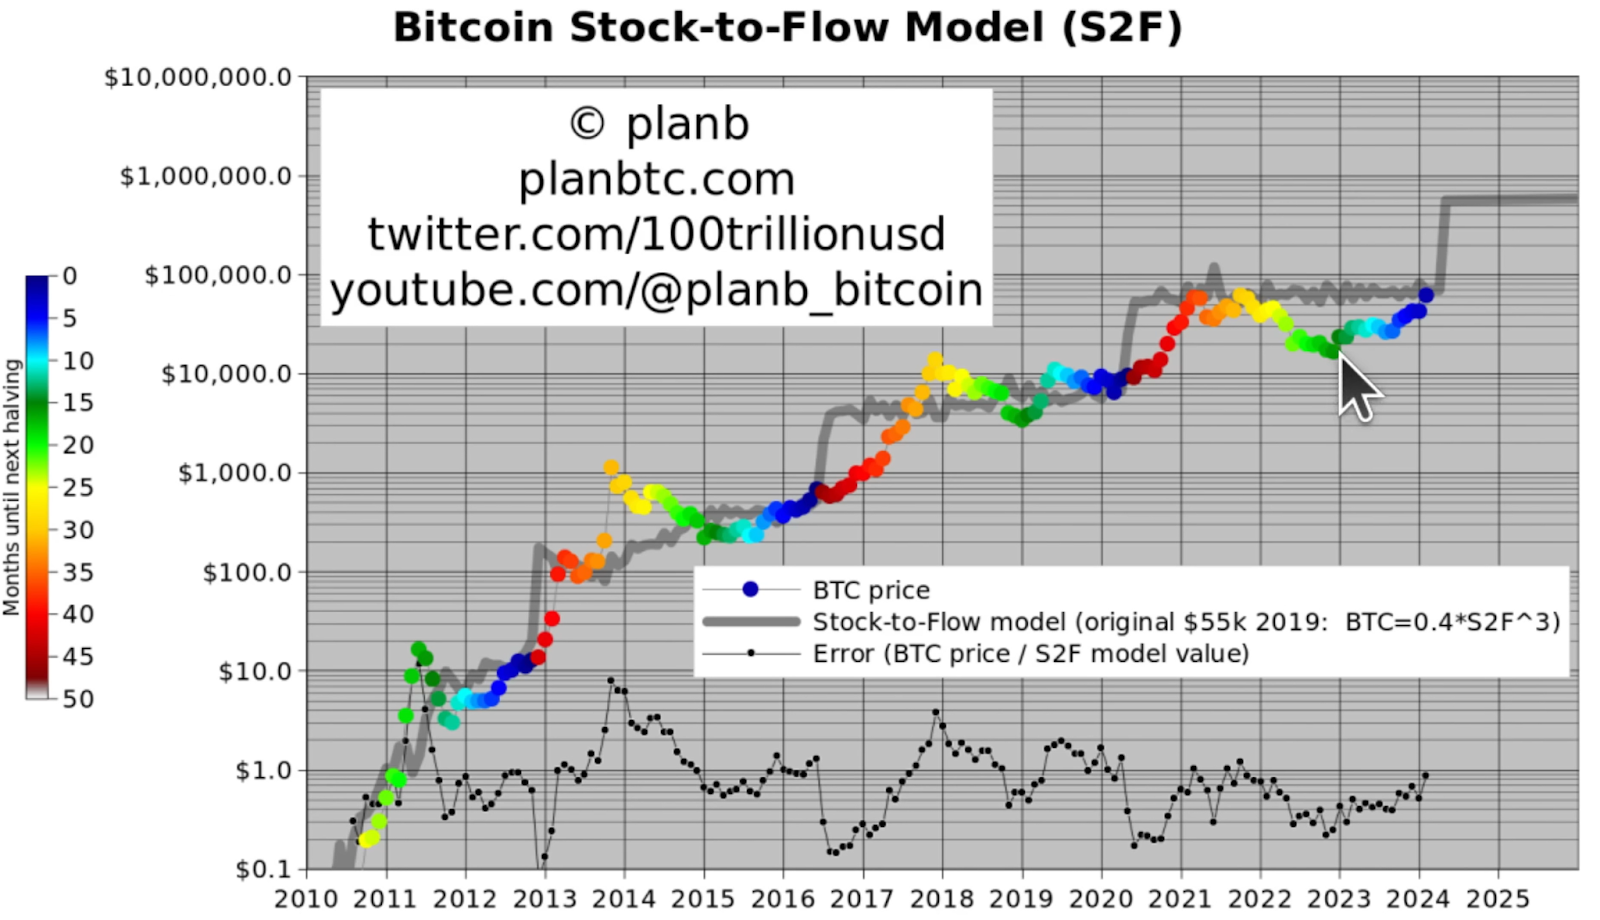
Stock-to-Flow: Quantifying Scarcity

One popular framework used to understand the impact of halvings on Bitcoin’s price is the Stock-to-Flow (S2F) model. This model quantifies the scarcity of a resource by comparing the available supply (stock) to the new supply added over time (flow). Bitcoin’s halving events effectively decrease the flow of new bitcoins, doubling the S2F ratio and increasing scarcity. Historical data supports the correlation between Bitcoin’s price and the S2F model, indicating that as scarcity increases, the price tends to rise.

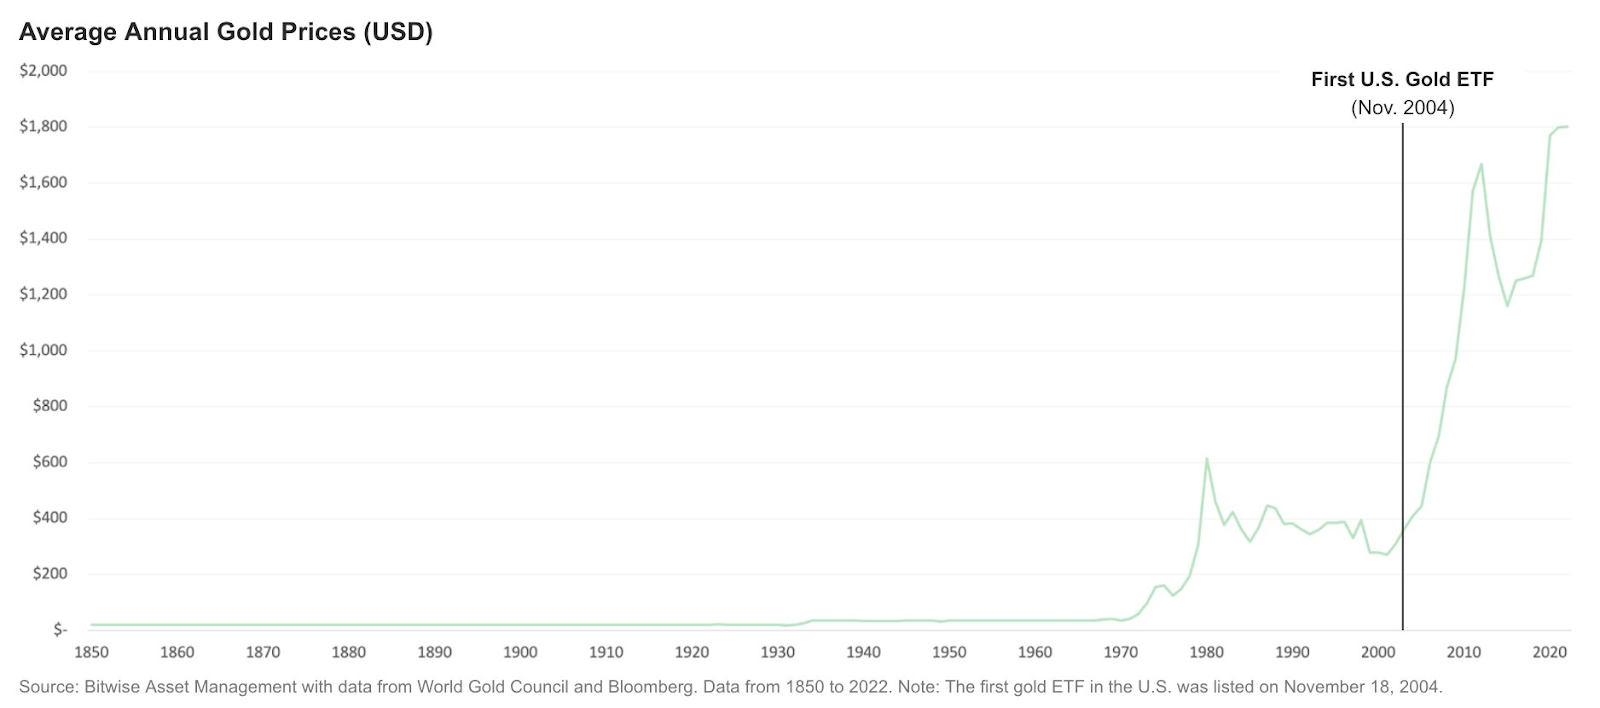
The S2F model suggests that Bitcoin’s scarcity, as quantified by the S2F ratio, is a key driver of its price. The higher the S2F ratio, the scarcer the resource is perceived to be, potentially leading to higher demand and value. Proponents of the S2F model argue that Bitcoin’s scarcity is a fundamental characteristic that differentiates it from traditional fiat currencies and positions it as a store of value similar to precious metals like gold.

Plan B, the creator of the stock-to-flow model recently predicted that Bitcoin will actually exceed the Stock-to-Flow Model this cycle, as it has in the past after periods of underperforming the model.

It is important to note, however, that the S2F model has its limitations. It simplifies the relationship between scarcity and price, assuming that scarcity is the primary determinant of Bitcoin’s value. While scarcity is a significant factor, other variables such as market sentiment, adoption rates, regulatory developments, and macroeconomic conditions can also influence Bitcoin’s price. The model’s predictive power is based on historical data, which might not necessarily persist in the future. Therefore, while the S2F model provides a valuable perspective, it should not be the sole basis for investment decisions.

Macro Influence on Bitcoin’s Price:

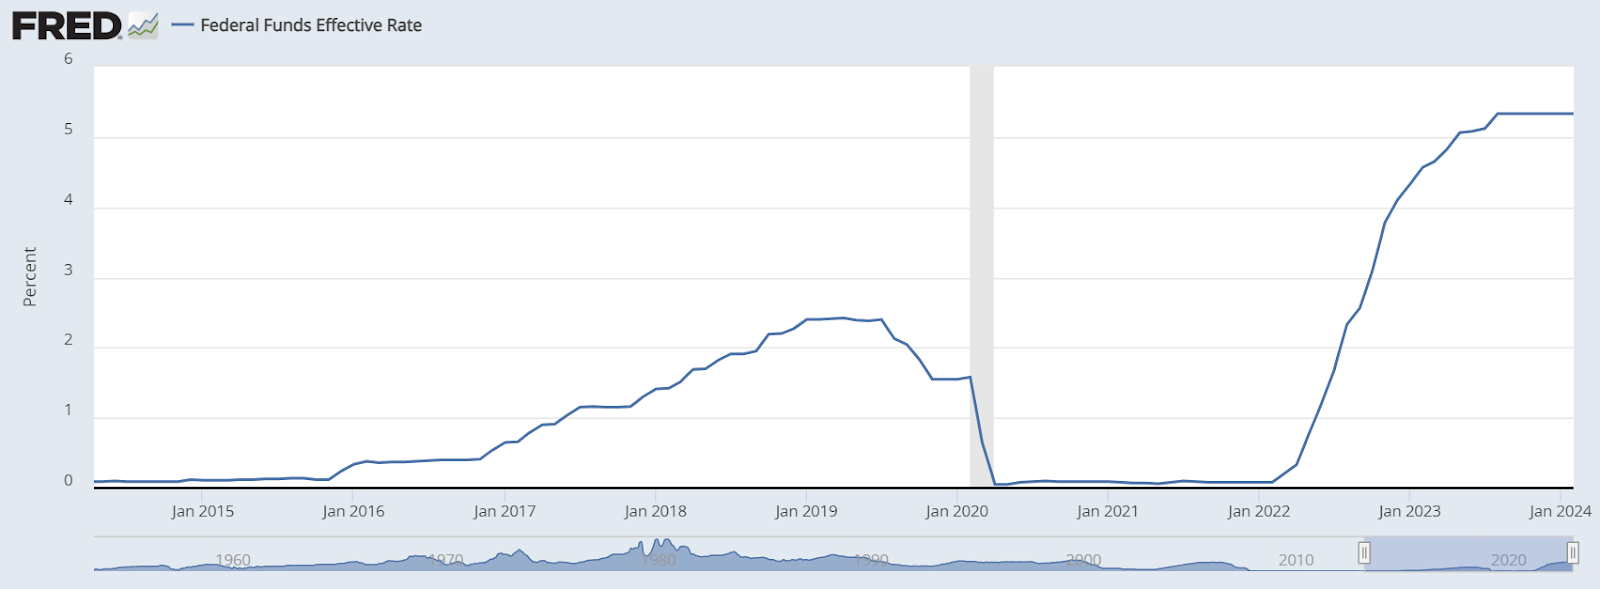
While the S2F model provides a useful lens for assessing Bitcoin’s scarcity, it is essential to consider macroeconomic factors that surround Bitcoin halvings. Global economic volatility, shifts in monetary policy, and broader economic conditions can significantly influence Bitcoin’s price. Historical analysis of previous halvings reveals that heightened economic uncertainty often coincides with increased interest in Bitcoin, potentially amplifying the price effects of halvings.

The macroeconomic context surrounding Bitcoin halvings is crucial to understanding their impact on price. Economic factors such as inflation, monetary policy decisions, and geopolitical events can shape market sentiment and investor behavior. For example, during the 2020 Bitcoin halving, the COVID-19 pandemic led to large-scale stimulus measures and increased inflation expectations. As a result, individuals turned to Bitcoin as a potential hedge against inflation, driving up demand and contributing to its price appreciation.

Each halving event occurs in a unique economic landscape, and its effects are intertwined with broader market dynamics. Understanding the macroeconomic influences on Bitcoin’s price can provide valuable insights into the potential opportunities presented by halvings. 

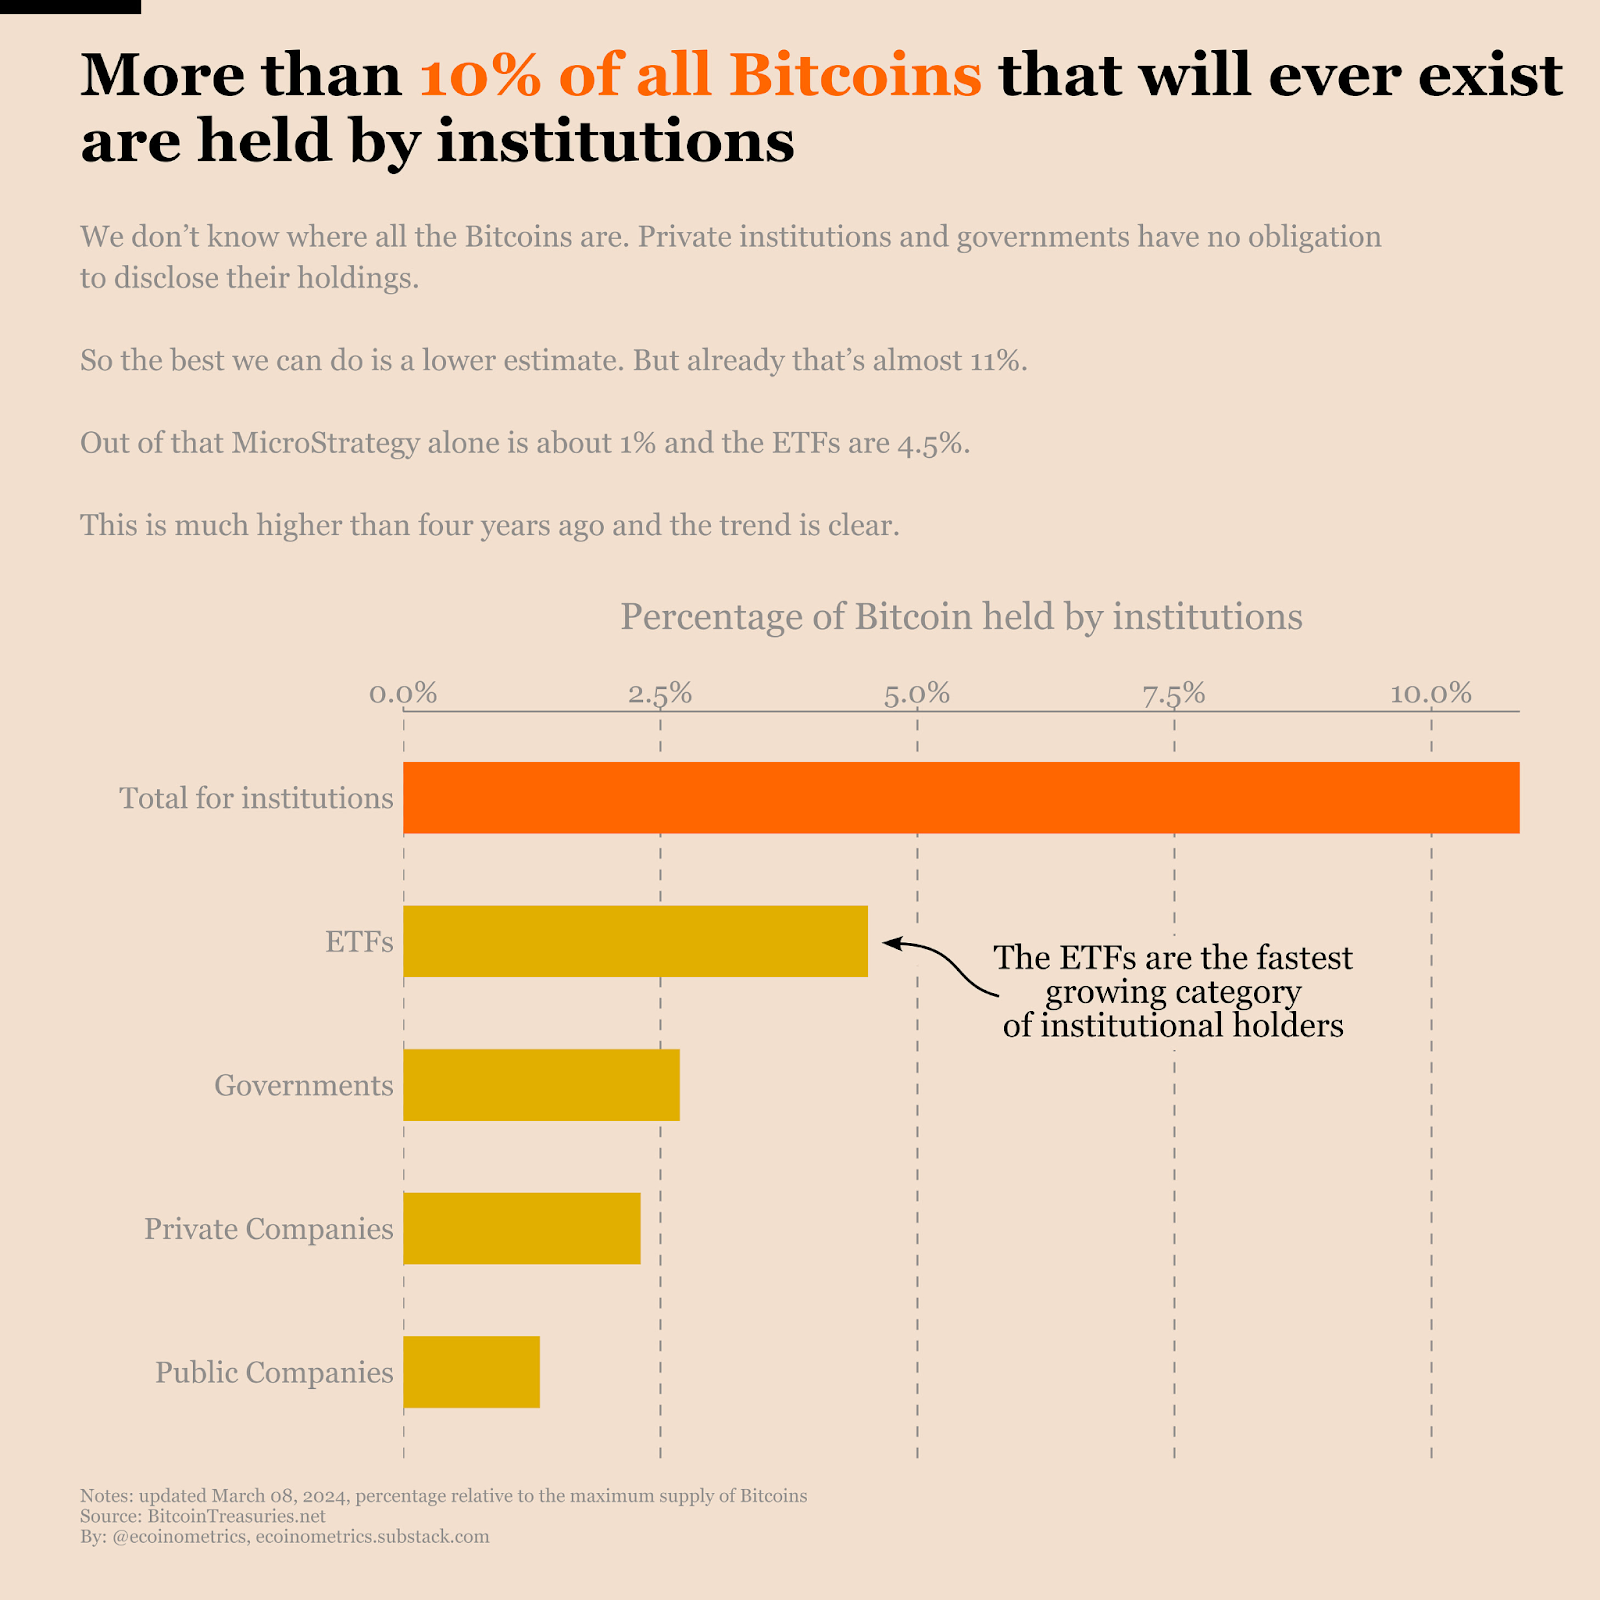
Many analysts are anticipating a different trajectory for Bitcoin this halving, after the recent wave of Bitcoin ETFs opened Bitcoin to a wider spread of institutional investors. 

A Bitcoin Buying Opportunity

As we approach the 2024 Bitcoin halving, an opportunity arises for investors looking to buy Bitcoin. The historical patterns and the potential scarcity created by halvings suggest that Bitcoin’s price could experience an upward trajectory. While price appreciation is not guaranteed, understanding the dynamics at play can help inform investment decisions.

The buying opportunity presented by the 2024 halving stems from the combination of scarcity, historical patterns, and macroeconomic influences. Bitcoin’s limited supply and deflationary nature make it an attractive long-term investment option for those seeking an alternative store of value. The anticipation of reduced future supply, coupled with increasing demand, may contribute to the price appreciation observed in previous halvings.

As we count down to the Bitcoin halving event expected in April 2024, investors have a small window of opportunity to consider buying Bitcoin before the halving takes place. Historical patterns and the scarcity created by halvings suggest that Bitcoin’s price is likely to experience a strong upward trajectory following the halving event. 

However, it is essential to approach investment decisions with a comprehensive understanding of the complex dynamics at play. Factors such as global economic conditions, technological advancements, and market sentiment should be considered alongside the halving event. By carefully evaluating these factors, you can make informed decisions regarding the potential benefits of buying Bitcoin.

As always, this article does not constitute financial advice. You should be sure to do your own research and consult a professional financial advisor before making a major investment decision.


To stay up to date on all things crypto, like Xcoins on Facebook, and follow us on Twitter, Instagram, TikTok, and LinkedIn.

Subscribe to our newsletter

    A raging bull made of pixelated Bitcoin symbols charging upwards through charts and graphs, leaving a trail of dollar signs in its wake.
    March 27, 2024

    Why Plan B Expects Bitcoin to EXCEED the Stock-to-Flow Model this Cycle

    March 27, 2024

    The long-awaited Bitcoin bull run has officially begun, according to the famous analyst Plan B and his stock-to-flow model. 

    Plan B is now expecting Bitcoin to break through and vastly exceed the stock-to-flow model’s upside in this cycle, just as it has done historically after periods of underperforming the model. 

    The stock-to-flow model had been criticized as “broken” when Bitcoin prices were depressed below the model’s values in 2022. However, this is a pattern seen before, with Bitcoin eventually blowing past the model’s expectations as a new bull phase takes hold.

    Plan B’s Stock-to-Flow Model via Plan B on Youtube
    Plan B’s Stock-to-Flow Model via Plan B on Youtube

    With only days to go until the next halving in April 2024, now could be an optimal time to buy Bitcoin before it potentially goes stratospheric. 

    Historically, steep Bitcoin gains have followed in the wake of these halving events as new supply is cut in half, putting upwards pressure on the price.

    When Will the Bitcoin Top Arrive?

    Based on past cycles, Plan B predicts the peak of this Bitcoin bull run will likely occur in 2025, not 2024 as many analysts are anticipating. 

    He anticipates Bitcoin will begin rising strongly after the halving event in April 2024, but with a slight delay as was seen in previous halvings. 

    The “Red Dot” marking the start of the bull phase has now flashed on Plan B’s charts. This signals we have officially transitioned from the accumulation phase to a bull market phase, according to Plan B.

    Bitcoin Market Cycle Chart via Plan B on Youtube
    Bitcoin Market Cycle Chart via Plan B on Youtube

    A bull market phase for Bitcoin is characterized by “face-melting FOMO, extreme price pumps, and multiple -30% dips” according to Plan B. 

    The volatile conditions can be scary for those unfamiliar with Bitcoin’s cyclical bull markets. However, the analyst advises staying calm and not panic-selling during any incoming 30% dips, as they have been commonplace after past peaks.

    In the 2017 bull run for example, there were around 5-6 separate drawdowns of over 30% before new highs were established. 

    Thanks to improved fundamentals like the Bitcoin ETF launches drawing billions in institutional inflows, we could expect even more extreme price action in this cycle compared to 2017 and 2021.

    How High Could Bitcoin Go?

    Plan B’s charts reveal incredibly bullish signs that suggest Bitcoin has a long runway ahead in this cycle. 

    The Relative Strength Index (RSI), a closely-watched technical indicator, recently hit 73. This is nearing the overbought levels of 90-100 that were sustained in past bull runs during periods of buyer euphoria.

    Relative Strength Index (RSI) Chart via Plan B on Youtube
    Relative Strength Index (RSI) Chart via Plan B on Youtube

    While a high RSI can precede short-term pullbacks, Plan B notes that in a bull market, RSI readings of 60-70 can persist for extended periods as prices continue grinding higher. 

    This is a stark difference from traditional equities markets where RSIs over 70 are considered strongly overbought. Bitcoin has a history of experiencing those very extended overbought conditions during its wildest upswings.

    More importantly, Bitcoin is now trading well above all of its key moving averages and realized prices from historic buyer levels. This indicates there is a lack of strong resistance overhead as nearly all holders are in profit and unwilling to sell at current levels. 

    The 200-week moving average of around $32,000 should act as a “floor” that will not get breached on monthly closes according to Plan B. 

    More critically, he stated Bitcoin may “never again” trade below the $49,000 short-term holder realized price.

    200 Week Moving Average (MA) Chart via Plan B on Youtube
    200 Week Moving Average (MA) Chart via Plan B on Youtube

    The data suggests that if you buy Bitcoin before the halving in April 2024, you could be well-positioned to capture exponential gains as this cycle’s bull run driven by the advent of institutional adoption potentially eclipses previous cycles.

    Bitcoin is a revolutionary asset with a finite supply capped at 21 million coins. As new supply issuance is cut roughly in half every four years, upwards pricing pressure is typically applied in the year or two following these halving events. 

    With Wall Street finally warming up to Bitcoin through vehicles like ETFs, and sovereign nation states exploring digital currency options, the fundamental investment case for Bitcoin has arguably never been stronger heading into the 2024 halving.

    As always, this article does not constitute financial advice. You should be sure to do your own research and consult a professional financial advisor before making a major investment decision.

    To stay up to date on all things crypto, like Xcoins on Facebook, and follow us on Twitter, Instagram, TikTok, and LinkedIn.

    Subscribe to our newsletter

      bitcoin falling out of boat in storm
      March 25, 2024

      Bitcoin Volatility is Back with a Vengeance!

      March 25, 2024

      Bitcoin navigated turbulent waters last week amidst interest rate anticipation and significant outflows from Spot ETFs. 

      The Federal Reserve’s decision to maintain interest rates, coupled with projections for rate cuts throughout 2024, sets the stage for market unease amid concerns over accelerating inflation. 

      Meanwhile, Bitcoin’s resilience faced a test as outflows from GBTC escalated, casting a shadow over market sentiment. 

      However, amidst this backdrop, a surge in volatility signaled bullish optimism, MicroStrategy made waves as it joined the 1% club, and BlackRock unveiled its pioneering tokenized asset fund, ‘BUIDL’, that leverages the Ethereum blockchain.

      Bitcoin battles interest rate anticipation and ETF outflows

      In a week marked by anticipation surrounding the Federal Reserve’s stance on interest rates and significant outflows from the Grayscale Bitcoin Trust (GBTC), Bitcoin has navigated through turbulent waters.

      The Federal Reserve, in its latest Federal Open Market Committee meeting, opted to maintain interest rates at 5.25%-5.5%, aligning with market expectations. 

      US Fed Funds Rate from 2014 to 2024
      US Fed Funds Rate from 2014 to 2024

      Moreover, policymakers projected a steady path for rate cuts throughout the year, foreseeing a decrease to 4.6% by the end of 2024. 

      While this decision eased concerns of a more hawkish approach, it also hinted at potential challenges ahead, particularly in light of recent economic indicators such as the Consumer Price Index and Producer Price Index reports, which surpassed expectations, stirring fears of accelerating inflation.

      Bitcoin initially surged past $64,000 following the Fed’s announcement, offering a glimpse of optimism for investors. 

      However, market sentiment took a downturn amidst reports of escalating outflows from the Grayscale GBTC, marking the first week of net negative flows since late January for U.S.-listed spot bitcoin ETFs. 

      The cryptocurrency faced intensified volatility, slipping below $63,000 during the U.S. session on Friday amid a broader sell-off across the market. 

      The significant outflows from GBTC, totaling over $830 million throughout the week, have contributed to the market unease. 

      Notably, Thursday saw GBTC experiencing $359 million in outflows, leading to a substantial decrease in net inflows across the fund group. 

      Analysts suggest that Genesis selling shares as part of its bankruptcy process might fuel this trend. 

      However, there is optimism that as these sales conclude, ETF inflows could rebound, especially amidst favorable macroeconomic conditions and accommodative central bank policies.

      Summary of Bitcoin ETF flows
      Summary of Bitcoin ETF flows

      Bitcoin market optimism resurges as volatility increases

      The Bitcoin market is witnessing a surge in volatility that has some analysts buzzing with excitement. 

      According to data collected by Ecoinometrics, since the dawn of 2023, Bitcoin has been on an impressive ascent, marking a remarkable 285% increase in value. 

      The momentum has only intensified since the beginning of this year, with Bitcoin notching up a 50% surge, culminating in a new historic pinnacle at $74,000.

      However, the resurgence of Bitcoin’s bullish stride didn’t transpire overnight; it has been a gradual progression spanning over a year. 

      Since the debut of Spot Bitcoin ETFs in early January 2024, a familiar on-chain activity pattern has emerged, indicative of a flourishing market. 

      Specifically, volatility, which has long been considered a hallmark of bull markets, has made a resounding comeback.

      During Bitcoin’s recovery phase, following the trough of the bear market, volatility had been on a downward trajectory. 

      Yet, this trend has now been upended, with volatility reclaiming its place in the market dynamics. 

      Rather than a cause for trepidation, this resurgence in volatility is embraced as an inherent characteristic of bull markets.

      Indeed, volatility should not be viewed through a lens of fear; instead, it presents an opportunity for greater upside potential, particularly for those willing to adopt a broader perspective. 

      Bitcoin volatility from 2020 to 2024
      Bitcoin volatility from 2020 to 2024

      MicroStrategy joins the 1% club

      According to Executive Chairman Michael Saylor, MicroStrategy, the business intelligence provider, has acquired an additional 9,245 bitcoins, amounting to $623 million, or roughly $67,400 per coin. 

      This acquisition propels MicroStrategy’s total bitcoin holdings to approximately 214,246 BTC, a milestone that now represents more than 1% of the entire 21 million bitcoin supply envisioned to ever exist.

      The procurement was facilitated through a combination of $592.3 million generated from MicroStrategy’s recent convertible debt offering and $30.7 million in surplus cash reserves. 

      With this latest investment, MicroStrategy solidifies its position as a significant player in the cryptocurrency market.

      At current market prices, MicroStrategy’s bitcoin holdings are valued at $13.5 billion, a testament to the company’s steadfast commitment to digital assets. 

      Since initiating its foray into Bitcoin, MicroStrategy has allocated approximately $7.53 billion towards amassing its BTC trove, with an average purchase price of $35,160 per coin.

      Despite news of the substantial investment, MicroStrategy’s stock experienced a downturn during the week.

      With bitcoin’s value dipping to $63,000 in the following days, MSTR shares have declined by over 10% throughout the week. 

      This decrease marks a 25% deviation from the company’s recent record high achieved just days ago.

      MicroStrategy/Bitcoin ratio that shows the comparative value ratio between MicroStrategy’s stock price and the price of Bitcoin

      BlackRock launches the ‘BUIDL’ tokenized asset fund on Ethereum

      BlackRock, the global investment powerhouse, has revealed its groundbreaking venture into tokenized asset management. 

      Dubbed ‘BUIDL’, this innovative fund is poised to redefine investment strategies by leveraging the Ethereum blockchain, marking BlackRock’s inaugural foray into public blockchain-based fund issuance.

      Tweet from Altcoin Daily announcing BlackRock’s new fund
      Tweet from Altcoin Daily announcing BlackRock’s new fund

      The initiative, initially registered as the BlackRock USD Institutional Digital Liquidity Fund in the British Virgin Islands last year, aims to revolutionize investor access to blockchain offerings. 

      By enabling seamless issuance and transparent trading of ownership on the Ethereum network, BUIDL promises instant settlement and cross-platform transfers, augmenting the accessibility and efficiency of investment opportunities.

      While the announcement sets a minimum investment threshold of $5 million, exceeding expectations outlined in its SEC filing, the fund’s application values ranged broadly from $1 to $100 million. 

      To bridge the gap between Ethereum and traditional financial markets, BlackRock has partnered with Bank of New York Mellon, a renowned provider of investment services, to serve as custodian and administrator of the fund’s assets.

      Moreover, BlackRock’s collaboration with Securitize Markets, LLC, an SEC-registered transfer agent, underscores its commitment to harnessing the transformative potential of tokenized securities. 

      BlackRock has not only invested in Securitize but also appointed Joseph Chalom, BlackRock’s global head of strategic ecosystem partnerships, to the Securitize board of directors, signaling a deepening partnership between the two entities.

      To stay up to date on all things crypto, like Xcoins on Facebook, and follow us on Twitter, Instagram, and LinkedIn.

      Subscribe to our newsletter

        An illustration of a rollercoaster track shaped like the Bitcoin logo, with a cart full of investors holding onto their hats as they navigate the ups and downs, representing the volatility leading up to the halving event.
        March 20, 2024

        How Low Could Bitcoin Go? Timing the Pre-Halving Dip

        March 20, 2024

        As Bitcoin dives while the crypto community braces itself for the upcoming Bitcoin halving in April 2024, many are wondering, “how low can Bitcoin go?” 

        With Bitcoin currently priced at $63K as of March 20, 2024, down $10K from its recent all-time high, speculation is rife. 

        Let’s delve into what history suggests about this pre-halving dip!

        The Historical Context of Pre-Halving Dips

        Historically, Bitcoin has experienced significant retraces, or dips, in the final weeks leading up to its halving events. 

        Tweet by @CryptoJelleNL illustrating historical pre-halving pullbacks
        Tweet by @CryptoJelleNL illustrating historical pre-halving pullbacks

        For instance, in 2020 and 2016, the retraces were -20% and -40%, respectively. These dips in the last days before a Bitcoin halving, often termed the “Danger Zone,” reflect a time of heightened volatility and market uncertainty. 

        Understanding these patterns is crucial for investors trying to navigate the turbulent waters of crypto investment.

        Tweet by @rektcapital explaining the pre-halving “danger zone”
        Tweet by @rektcapital explaining the pre-halving “danger zone”

        Why Is Bitcoin Crashing? Analyzing the Present Dip

        This current dip can be attributed to several factors. Seasoned investors recognize these pre-halving dips as periods of market correction, where the “weak hands” — less experienced or more risk-averse traders — are likely to sell off their holdings, often at a loss, to the more steadfast “strong hands.” 

        This phenomenon is partly driven by fear, speculation based on historical patterns, and the psychological impact of round numbers, with $60k being widely touted as a critical level of interest.

        The Fear Factor 

        The market’s cooling, as evidenced by this dip, could signify that we are entering a phase of consolidation before the next bull run. The fear creeping into the market, especially among newcomers, has some suggesting that we may be nearing the bottom of this correction. 

        However, historical patterns suggest that corrections of over 20-30% from all-time highs (ATH) are not uncommon, with the current ATH of $73,737 pointing towards potential lows of $58,989 (-20%) and $51,615 (-30%). 

        Of course, Bitcoin could see an even larger pre-halving dip as in 2016 when prices fell 40% from ATHs, but few speculators are predicting such a low dip given the ETF-fuelled bullish sentiment that has been sweeping the market in 2024.

        The Opportunity in the Dip

        Despite the apparent downturn, this dip presents a compelling buying opportunity for those looking to capitalize on the pre-halving market dynamics. 

        The rationale is simple: post-halving, Bitcoin has historically entered a phase of price discovery, leading almost like clockwork to significant bull runs. For those willing to endure the short-term volatility, the long-term prospects remain promising.

        How Low Will Bitcoin Go?

        Predicting the exact bottom of this dip is challenging and arguably foolish, given the myriad of factors at play. However, based on historical data and current market sentiment, the $58,989 to $51,615 range appears to be a plausible zone for the market to bottom out. This range not only aligns with the widely expected 20-30% correction seen preceding previous halvings but also aligns closely with key psychological thresholds for many investors.

        The Silver Lining: Buying Before the Halving

        For investors and enthusiasts, the silver lining in this dip is the opportunity it presents. Buying Bitcoin during these lows, just before the halving, could position one favorably for the anticipated post-halving bull run. 

        The key is to maintain a long-term perspective, focusing on the fundamentals of Bitcoin and its decreasing supply post-halving, which could drive its value up.

        Don’t Bank on a Deeper Dip

        For the first time in Bitcoin’s storied history, we’ve just witnessed an all-time high (ATH) right before a halving event, rather than after. 

        This unprecedented occurrence marks a significant departure from the cyclical patterns long-time observers and investors have come to anticipate. 

        Such a deviation suggests that the historical data, while invaluable, might not be as predictive of future movements as it once was. In the face of new factors tipping the balance, banking on a deeper dip based on past cycles could be a risky strategy that overlooks the unique market dynamics at play in the current cycle.

        Adding to the complexity of the current landscape is the recent approval of Bitcoin ETFs, a development that has the potential to inject unprecedented levels of liquidity into the market. The availability of Bitcoin ETFs to a wider range of investors not only legitimizes cryptocurrency as an asset class but also simplifies the process of investing in Bitcoin, potentially leading to increased demand and, consequently, higher prices

        This factor alone could significantly alter the trajectory of this cycle’s bull run, offering a boost that was absent in previous cycles. As such, investors should tread carefully when attempting to time the bottom, considering the impact of these new variables rather than relying solely on the patterns of the past. 

        Navigating the Pre-Halving Dip

        While the short-term outlook may seem daunting, the long-term perspective for Bitcoin remains robust. For the astute investor, this dip could represent a strategic entry point, aligning with the age-old wisdom of buying low and selling high.

        Remember, while historical patterns can provide insights, the cryptocurrency market is inherently unpredictable. Always do your own research (DYOR), consider your risk tolerance, and, if necessary, consult with financial advisors before making investment decisions. The journey ahead may be fraught with volatility, but for those who hold (‘HODL’), the rewards could be significant.

        This article is for informational purposes only and should not be taken as financial advice. Always conduct your research and consult with a professional before making any investment decisions.

        To stay up to date on all things crypto, like Xcoins on Facebook, and follow us on Twitter, Instagram, and LinkedIn.

        Subscribe to our newsletter

          bitcoin en un tobogan
          March 18, 2024

          Crypto Markets Slide Lower on Hot Inflation Data

          March 18, 2024

          Amidst a backdrop of market volatility, the recent retracement of Bitcoin from its all-time high, triggered by hot inflation data, reverberated across altcoins last week, prompting significant declines. 

          However, amidst these varied narratives, Ethereum derivatives maintained their resilience, showcasing sustained confidence in the face of market uncertainties. 

          Concurrently, Ethereum’s Dencun upgrade catalyzed a monumental reduction in layer-2 gas fees, heralding a new era of scalability and Elon Musk’s resurgence in advocating for Dogecoin as a viable payment option for Tesla products reignited fervor among enthusiasts. 

          After a new all-time high Bitcoin retraces on hot inflation data

          After soaring to an unprecedented pinnacle of $73,750, Bitcoin has continued to trade lower over the weekend due to higher-than-expected inflation results.

          This dramatic dip has rippled across the cryptocurrency landscape, with numerous altcoins also experiencing declines exceeding 10%.

          Multiple factors have emerged as potential explanations for this market upheaval.

          Firstly, the release of economic data in the United States sent shockwaves through the financial sphere on Thursday. 

          The Consumer Price Index, a barometer of price fluctuations across a spectrum of goods and services, revealed a notable increase of 0.4%, surpassing expectations. 

          Similarly, the Producer Price Index, indicating price alterations post-manufacturing, surged by 0.6%, outstripping forecasts by a significant margin. 

          These findings underscore a persistent inflationary pressure, triggering a cascade of reactions within the market ecosystem.

          According to the CME Fed Watch tool, investors have dropped expectations for a Federal Reserve interest rate pivot to 2% for this Wednesday’s FOMC meeting and to 6% for the next FOMC meeting in May. 

          Target rate probabilities for the May FOMC meeting
          Target rate probabilities for the May FOMC meeting

          In addition to interest rate concerns, the cryptocurrency market was roiled by a flurry of liquidations, with a staggering 233,000 traders facing forced closure of positions, amounting to a colossal sum of $775 million. 

          The magnitude of these liquidations underscores the fragility of overleveraged positions and the inherent risks associated with margin trading.

          Despite the apparent turbulence, seasoned observers view these market corrections as a necessary purging mechanism. 

          While newcomers to the crypto sphere may find the volatility unnerving, veterans recognize its indispensable role in fortifying the market’s resilience and sustainability.

          Ethereum derivatives stand firm amid market volatility

          A tumultuous descent on March 15 for Ethereum prompted $126 million in forced liquidations within ETH futures. 

          Despite these uncertainties, Ethereum derivatives remained resilient, indicating sustained confidence in the market. 

          Perpetual contracts, known as inverse swaps, showed consistent positive funding rates, suggesting ongoing demand for leverage from traders holding long positions. 

          Typically, during bullish market phases, these rates surge significantly, but they have remained steady amidst the recent correction.

          Analysis of the balance between call (buy) and put (sell) options further solidifies this stance. 

          Over the past 10 days, the demand for Ether call options has outweighed that for protective puts by a notable margin, indicating a neutral stance among traders, with no significant shift towards bearish positions.

          Despite the volatility witnessed over the weekend, Ethereum derivatives continue to exhibit strength and stability, reaffirming the resilience of the bull market. 

          Put to call option ratio from March 1st to March 18th
          Put to call option ratio from March 1st to March 18th

          Ethereum layer-2 gas fees plummet post Dencun upgrade

          Ethereum’s recent Dencun upgrade, implemented on March 13, has catalyzed a remarkable reduction in transaction fees across various layer-2 protocols. 

          With some platforms witnessing a staggering decline of up to 99%, the Dencun upgrade is being hailed as a pivotal advancement in Ethereum’s scalability journey since the Merge.

          Starknet, a leading Ethereum-based L2 protocol, showcased a substantial 99% decrease in gas fees following the Dencun upgrade. 

          Prior to the upgrade, the gas fee stood at over $6, whereas post-upgrade, it plummeted to a mere $0.04.

          Similarly, other prominent L2 platforms such as Optimism, Base, and Zora OP mainnet also experienced significant drops in gas fees after the Dencun upgrade. 

          Optimism’s average transaction fees fell to $0.05, while Base recorded a reduction to $0.064. 

          Arbitrum and zkSync Era also observed decreases to $0.5 and $0.16, respectively, within the first 24 hours post-upgrade.

          Layer-2 median transaction fees during March 2024
          Layer-2 median transaction fees during March 2024

          The Dencun hard fork introduced nine Ethereum Improvement Proposals (EIPs), notably EIP-484, which introduced data blobs to L2s. 

          These data blobs, a novel transaction data type, bypass the conventional “call data” process, enabling faster transactions at reduced fees. 

          The upgrade, in development for two years, is considered one of the most intricate forks since the Merge, with a substantial emphasis on scalability and lowering gas fees.

          Elon Musk reignites Dogecoin fans

          In a recent visit to a Tesla facility near Berlin, Elon Musk reignited enthusiasm for Dogecoin as a potential payment option for Tesla products. 

          The visionary entrepreneur, renowned for his innovative ventures and forrays into cryptocurrency, expressed openness to enabling Dogecoin payments during an interaction with attendees.

          Musk’s remarks, captured in a widely circulated video on social media platforms like X, conveyed his positive stance on incorporating Dogecoin into Tesla’s payment ecosystem. 

          Tweet depicting Elon Musk’s talk at the Berlin Giga Factory
          Tweet depicting Elon Musk’s talk at the Berlin Giga Factory

          “At some point, I think we should enable that,” Musk affirmed, signaling potential support for the meme-inspired cryptocurrency. Embracing the spirit of Dogecoin enthusiasts, he echoed the rallying cry of “Dogecoin to the moon.”

          The tech luminary explained that hi’s endorsement of Dogecoin stems from grassroots support within Tesla and SpaceX, where factory workers advocated for its recognition. 

          Musk highlighted Dogecoin’s unique position as “the people’s crypto,” underscoring his commitment to backing it.

          Notably, Tesla presently accepts Dogecoin for merchandise transactions, alongside Bitcoin payments for vehicle purchases.

          Dogecoin’s ascent to prominence accelerated dramatically following Musk’s vocal endorsement on social media platforms in 2020, propelling its market capitalization to over $25 billion.

          Collaborative efforts between Dogecoin developers and Musk have sought to enhance the cryptocurrency’s utility and foster widespread adoption for everyday transactions. 

          Musk’s recent comments have injected fresh momentum into Dogecoin, triggering a notable price surge. At the time of Musk’s announcement, Dogecoin’s price surged to $0.18, marking a significant increase. 

          Although it has since dipped slightly to $0.14, the cryptocurrency remains buoyant, with a 4% gain over the past 24 hours and an impressive 73% surge over the last 30 days.

          To stay up to date on all things crypto, like Xcoins on Facebook, and follow us on Twitter, Instagram, and LinkedIn.

          Subscribe to our newsletter

            A futuristic digital art piece representing Ethereum's transition into a new era of blockchain technology post-Dencun Upgrade.
            March 13, 2024

            Ethereum’s Dencun Upgrade is LIVE: Price Surge Expected as ETH Leaps Towards Scalability and Efficiency

            March 13, 2024

            The Ethereum network has today completed one of its most significant upgrades since The Merge, and the crypto community is watching with bated breath. 

            The Dencun Upgrade, slated for March 13, 2024, has already pushed Ethereum’s (ETH) price beyond the $4,000 threshold, a feat last witnessed in December 2021. 

            ETH-USD 1-month price chart Via Trading View
            ETH-USD 1-month price chart Via Trading View

            This upgrade introduces EIP-4844 or proto-danksharding, which aims to revolutionize gas fees on L2 networks, heralding a new dawn of efficiency and scalability.

            Gas Fees Set to Plummet on L2s

            Marking the commencement of “The Surge” phase in Ethereum’s roadmap, the Dencun Upgrade encompasses nine critical Ethereum Improvement Proposals (EIPs). 

            At its core, EIP-4844 introduces “data blobs,” temporary storage solutions that promise to significantly enhance data availability capacity on the Ethereum mainnet. 

            This innovation is set to reduce L2 gas fees dramatically, making Ethereum a more attractive platform for developers and users alike.

            Why is Ethereum Surging? The Dencun Upgrade’s Role

            Scheduled to go live on March 13, 2024, the Dencun Upgrade is expected to be a pivotal moment for Ethereum. 

            By addressing some of the most pressing issues facing the network, such as scalability and gas fees, this upgrade is poised to unlock new possibilities and attract a broader user base. Key benefits include:

            • Enhanced Scalability: By leveraging proto-danksharding, Ethereum is set to significantly increase its network throughput, aspiring to reach and surpass 100,000 transactions per second.
            • Reduced Gas Fees: The implementation of proto-danksharding is expected to lower gas fees on L2 rollups, making transactions more cost-effective and competitive with traditional payment systems.
            • Improved Security and Cross-Chain Communication: The Dencun Upgrade will enhance the overall security of the Ethereum network while facilitating smoother interactions between different blockchain ecosystems.

            Experts Optimistic on Ethereum’s Future Post-Dencun

            Industry experts are optimistic about the Dencun Upgrade’s potential to reshape Ethereum’s landscape. By reducing congestion on the mainnet and lowering costs for users, this upgrade is seen as a critical step towards Ethereum’s long-term vision of achieving full danksharding. 

            While full danksharding remains a distant goal, the Dencun Upgrade is a significant milestone in Ethereum’s journey towards unprecedented scalability and efficiency.

            Why Buy Ethereum Now?

            With the successful implementation of the Dencun Upgrade, Ethereum stands on the brink of a transformative era. This upgrade not only addresses key challenges but also sets the stage for future developments that will further enhance the network’s capabilities. 

            For investors and users wondering “Why buy Ethereum?” the answer lies in the network’s unwavering commitment to innovation, scalability, and user-centric solutions. As Ethereum continues to surge, now is a pivotal moment to be part of its journey towards redefining the blockchain landscape.

            As always, this article does not constitute financial advice. You should be sure to do your own research and consult a professional financial advisor before making a major investment decision.


            To stay up to date on all things crypto, like Xcoins on Facebook, and follow us on Twitter, Instagram, TikTok, and LinkedIn.

            Subscribe to our newsletter

              A-rectangular-blog-cover-image-featuring-a-gigantic-shining-gold-Bitcoin-coin-at-the-center
              March 11, 2024

              Bitcoin Secures $70,000 as Institutions Accumulate

              March 11, 2024

              Bitcoin has crossed the $70,000 milestone for the first time in its existence as investor appetite continues to be fueled by institutional adoption and the oncoming halving.

              Concurrently, market sentiment has reached a three-year peak of “extreme greed,” propelled by Bitcoin’s price spikes and heightened activity in derivatives markets.

              Amidst this backdrop, speculation surrounding Tesla’s potential reengagement with Bitcoin gains traction, with murmurs of increased holdings sparking intrigue. 

              Meanwhile, Bitcoin whales, undeterred by record highs, demonstrate steadfast accumulation.

              With a lot of fundamental drivers to break down from last week, let’s dive in.

              Bitcoin breaches $70,000 for the first time

              Bitcoin surged to an all-time high on Friday, breaching the elusive $70,000 mark for the first time in its history. 

              BTC/USD price chart

              The momentum behind this surge continues to be fueled by a fervent demand from investors for new US spot exchange-traded cryptocurrency products, coupled with anticipation of a global downturn in interest rates.

              This surge has been further buoyed by optimistic projections, including an impending upgrade to the Ethereum blockchain platform and the upcoming Bitcoin “halving” event scheduled for April, which is set to decelerate the pace of Bitcoin mining.

              Following its first record-breaking high of the week on Tuesday, Bitcoin experienced a sharp reversal, plummeting more than 10% to dip below the $60,000 mark once again.

              However, the world’s leading crypto recovered by an impressive 15% to once again post record highs 3 days later.

              Furthermore, institutional investors, who once hesitated to engage with cryptocurrencies due to their erratic fluctuations, have increasingly committed long-term investments. 

              According to Ecoinometrics, the institutionalization of Bitcoin continues to gather momentum, with institutions already holding a substantial portion of the total Bitcoin supply. 

              Estimates suggest that approximately 11% of Bitcoin’s maximum supply is now held by institutions, with ETFs now accounting for a significant portion of this ownership at 4.5%.

              Chart displaying the percentage of Bitcoin held by institutions via Ecoinometrics
              Chart displaying the percentage of Bitcoin held by institutions via Ecoinometrics

              Fear and greed index reaches 3-year high

              Cryptocurrency enthusiasts are witnessing an unprecedented surge in market sentiment as the Fear and Greed index soars to levels not seen in three years. 

              Tweet from CoinGecko depicting Bitcoin’s Fear and Greed Index

              The index, which gauges investor sentiment towards Bitcoin, has surged to an astounding 90, marking a level of “extreme greed” last experienced in February 2021.

              This surge in sentiment comes on the heels of a remarkable momentum in the spot Bitcoin ETF market. 

              With Bitcoin’s price hitting all-time highs, investors are displaying a voracious appetite for the leading cryptocurrency, propelling the market into a state of euphoria.

              However, despite the overwhelming greed permeating the market, Bitcoin’s price continues to exhibit volatility, keeping traders on their toes. 

              Notably, open interest in Bitcoin futures has been on the rise, reflecting heightened activity in derivative markets.

              The recent frenzy in Bitcoin futures trading has led to significant liquidations, which was exemplified by last Tuesday’s sharp price movements. 

              Within a mere hour of Bitcoin reaching its all-time high on March 5th, long liquidations amounted to a staggering $35 million, catching many market participants off guard.

              Bitcoin Fear and Greed Index from 2018 to 2024
              Bitcoin Fear and Greed Index from 2018 to 2024

              Has Tesla purchased more Bitcoin? Rumors spiral

              Cryptocurrency enthusiasts are abuzz with speculation as Tesla’s Bitcoin holdings once again come under scrutiny. 

              Recent data from Arkham Intelligence’s cryptocurrency analytics platform reveals an intriguing increase in Tesla’s Bitcoin wallet, sparking speculation about potential new purchases by the electric car manufacturer.

              At present, Tesla’s Bitcoin wallet reportedly contains approximately 11,509 BTC, which is a significant jump from the 9,720 BTC reported during the company’s last earnings disclosure. 

              Tesla’s BTC holdings according to Arkham
              Tesla’s BTC holdings according to Arkham

              This notable increase has reignited discussions surrounding Tesla’s stance on the flagship cryptocurrency and its potential reentry into the market.

              The saga of Tesla and Bitcoin has been a rollercoaster ride. 

              Back in February 2021, amidst great fanfare, Tesla announced its acquisition of $1.5 billion worth of Bitcoin, signaling a major institutional endorsement of the digital asset. 

              However, within months, the company sold a portion of its holdings, citing various reasons including volatility concerns and environmental considerations regarding Bitcoin mining. 

              Now, with the revelation of an uptick in Tesla’s Bitcoin wallet, speculation is rife once again. Some observers speculate that Tesla may have resumed accumulating Bitcoin, possibly in preparation for a forthcoming earnings call. Others ponder whether the altered figures might be attributed to an accounting anomaly rather than new purchases.

              Bitcoin whales refuse to sell

              Despite Bitcoin’s recent surge to record highs, the population of major holders, often referred to as whales, continues to expand. 

              According to recent data from LookintoBitcoin, there are now 2,104 unique addresses holding at least 1,000 Bitcoin, indicating a steady rise in whale activity in the cryptocurrency market.

              Bitcoin address holding over 1000 BTC vs price

              While this figure is slightly lower than the peak of 2,489 addresses recorded in February 2021, when Bitcoin was trading above $46,000, the current trend is noteworthy. 

              One of the most intriguing aspects of this trend is the reluctance of Bitcoin whales to sell their holdings despite soaring prices. 

              This behavior suggests a strong conviction among major holders that Bitcoin’s value will continue to appreciate in the foreseeable future. 

              Moreover, data from Glassnode reveals transfers from exchanges to whales have surged to new record highs, indicating a significant influx of Bitcoin into whale wallets. 

              However, the volume of transfers from whales to exchanges has seen only a modest increase, suggesting that wealthy investors are not rushing to cash out their holdings despite the current price levels.

              Chart displaying the number of Bitcoin transfers from exchanges to whale entities via Glassnode
              Chart displaying the number of Bitcoin transfers from exchanges to whale entities via Glassnode

              To stay up to date on all things crypto, like Xcoins on Facebook, and follow us on Twitter, Instagram, and LinkedIn.

              Subscribe to our newsletter

                Important Bitcoin Dates & Milestones in History

                March 11, 2024

                Bitcoin, the trailblazing cryptocurrency that gave birth to the world of crypto, has profoundly reshaped the landscapes of finance and technology since its inception in 2009. 

                Every year Bitcoiners around the world celebrate the key dates of the Bitcoin calendar. 

                An exploration of the important dates and milestones in Bitcoin’s history provides valuable insights into its evolution and growth. 

                This article presents these important dates and key events in chronological order, providing a thorough perspective on Bitcoin’s path and its far-reaching impact on the industry.

                August 18, 2008: The Dawn of Bitcoin.org

                The domain Bitcoin.org was registered, marking the first online presence of Bitcoin and playing a crucial role in its subsequent recognition and growth worldwide.

                October 31, 2008: Bitcoin Whitepaper Publication

                Satoshi Nakamoto published the seminal Bitcoin whitepaper, laying down the conceptual groundwork and technical specifications for the world’s first cryptocurrency.

                November 9, 2008: The Coining of ‘Blockchain’

                Bitcoin pioneer Hal Finney first used the term “blockchain,” emphasizing the ground-breaking technology that powers Bitcoin and has found broad applications across various sectors.

                An artist’s impression of Hal Finney who received the first recorded Bitcoin transaction and coined the term “Blockchain”.
                An artist’s impression of Hal Finney who received the first recorded Bitcoin transaction and coined the term “Blockchain”.

                January 3, 2009: The Genesis of Bitcoin

                Satoshi Nakamoto launched the Bitcoin network, bringing to life the innovative concept of a decentralized digital currency underpinned by blockchain technology.

                January 9, 2009: Bitcoin’s Release Date

                The starting block of the chain, was mined by Nakamoto on this day. The text “The Times 03/Jan/2009 Chancellor on brink of second bailout for banks” was embedded in this block, referring to an issue of the Times newspaper date and headline.

                January 12, 2009: The First Bitcoin Transaction

                Satoshi Nakamoto transferred Bitcoin to Hal Finney. This momentous event marked the first recorded Bitcoin transaction, showcasing its potential as a tangible medium of exchange.

                May 22, 2010: Bitcoin Pizza Day

                Laszlo Hanyecz made history by purchasing two pizzas for 10,000 Bitcoins, marking the first recorded transaction using Bitcoin for real-world goods. This event underscored Bitcoin’s potential for practical usage and highlighted its early adoption.

                pizza with tomato topping


                November 28, 2012: The First Bitcoin Halving Event

                This was a pivotal moment in the crypto world. At first, the halving had no noticeable effect on Bitcoin’s price. However, at the beginning of 2013, the coin’s value began to grow steadily, a phenomenon that has been repeated consistently after following halvings.

                July 1, 2013: First Attempt at a Bitcoin Exchange-Traded Fund (ETF)

                The Winklevoss twins were pioneers in trying to get Bitcoin traded publicly when they filed a proposal with securities regulators that would allow an exchange-traded fund consisting exclusively of Bitcoin. At the time, public sentiment held that it was a long shot that this proposal would ever go through and was considered as a strategic move to improve Bitcoin’s image as a legitimate currency.

                July 9, 2016: Bitcoin’s Second Halving

                Bitcoin’s second halving saw the new BTC per block reduced to 12.5 BTC per block from 25 BTC per block. Bitcoin’s price plummeted following the halving however had recovered and risen to an all-time high of $2,550 by July 2017.

                May 11, 2020: Bitcoin’s Third Halving

                This halving event saw Bitcoin miners being rewarded 6.25 BTC per block, reduced from 12.5 BTC per block. Similarly to 2016’s halving event, Bitcoin’s price plummeted following the halving, only to recover from its 2020 low of $3,858 and hitting $12,100 in late July 2020. On December 16th 2020, Bitcoin blasted through the 23k mark surpassing the historic $20,000 mark.

                January 10, 2023: Bitcoin ETF Approval 

                When SEC greenlit the approval of Bitcoin ETFs it signaled to the world that Bitcoin was here to stay and was ready to become widely available to the masses. Bitcoin ETFs’ primary advantage is that it allows investors to buy Bitcoin through traditional brokerage accounts unlike direct cryptocurrency purchases which require a certain level of technical knowledge and a crypto wallet.

                April 19, 2024: Bitcoin Halving 2024

                Exciting times are ahead as the next Bitcoin halving is set for April. So what can we expect from Bitcoin‘s halving in 2024? Historically, Bitcoin halvings have always brought with them price appreciation as scarcities are created by Bitcoin’s limited supply, creating a potential profit opportunity that is not to be missed.

                April 10, 2028: the Fifth Bitcoin Halving

                Hedge fund manager Mark Yusko is already predicting that Bitcoin will reach $300k by 2028, when comparing Bitcoin to gold and taking in consideration the future 2028 halving event.

                Looking at the upward trajectory that Bitcoin has been through over the last years is inspiring to say the least. By celebrating these pivotal moments each year, we can appreciate Bitcoin’s past, better understand its present, and look forward to its promising future as a decentralized digital currency continuing to change the world!

                Investing in Bitcoin now can help you reap rewards in the future however you should always look into investment decisions keeping in mind there are always complex dynamics at play. Factors such as global economic conditions, technological advancements, and market sentiment should be considered alongside the halving event. Make sure you always take these factors in consideration so that you can make informed decisions regarding the potential benefits of buying Bitcoin.


                To stay up to date on all things crypto, like Xcoins on Facebook, and follow us on Twitter, Instagram, and LinkedIn.

                Subscribe to our newsletter

                  Bitcoin overtaking a silver runner in a dramatic race through space
                  March 6, 2024

                  1B Liquidated as Bitcoin Makes History Striking New All-Time High and Overtaking Silver

                  March 6, 2024

                  In a dramatic turn of events, Bitcoin’s market capitalization soared to an unprecedented $1.35 trillion yesterday, eclipsing the value of Silver, before experiencing a sharp correction and subsequent recovery. 

                  It is the first time in history that Bitcoin has hit an all-time high in the run-up to a halving event, a signal that is leading analysts to elevate their expectations of the widely anticipated post-halving bull run.

                  The top digital currency’s market cap now hovers around $1.30 trillion, slightly trailing Silver’s $1.35 trillion, in a testament to its growing influence and adoption in the financial landscape.

                  BTC USD 1 Month Chart via TradingView
                  BTC USD 1 Month Chart via TradingView

                  Traders Hit By Massive Correction

                  Yesterday’s surge in Bitcoin’s price to a new all-time high of approximately $69,200 has been nothing short of spectacular, capturing the attention of investors and traders worldwide. However, this rapid ascent was not without its consequences, as the market witnessed a significant liquidation event, with over $1 billion in positions wiped out in a 24-hour period as the bitcoin price ricocheted. 

                  This marks one of the most volatile episodes in recent crypto history, highlighting the high-stakes nature of active trading and why investors are well advised to take a buy-and-hold approach to Bitcoin, “hodling” their cryptocurrency securely themselves, instead of risking it by day trading.

                  Data from CoinGlass reveals that the bulk of the liquidations impacted long positions, with about $816 million liquidated across crypto, compared to $261 million in short positions. 

                  Bitcoin, the pioneer and leading cryptocurrency, was at the epicenter of this financial whirlwind, with approximately $320 million in liquidations, predominantly affecting long traders.

                  Total Liquidations 24 hr Chart via Coinglass
                  Total Liquidations 24 hr Chart via Coinglass

                  This liquidation event serves as a stark reminder of the risks associated with leveraged trading in the highly volatile cryptocurrency market. Traders betting on continued upward momentum were caught off guard by the sudden short-lived $10K downturn in Bitcoin’s value, leading to significant losses.

                  Amid the tumultuous market movements and the substantial liquidations, the narrative for Bitcoin remains overwhelmingly positive. The digital asset’s ability to surpass the market capitalization of a traditional asset like Silver, even if briefly, signifies a monumental shift in investor sentiment.

                  Moreover, the quick recovery of Bitcoin’s price following the drop is a testament to its resilience and the strong demand from investors who view any significant dips simply as buying opportunities. 

                  This resilience underscores the growing confidence in Bitcoin’s long-term potential and its role in diversifying investment portfolios.

                  For long-term investors and Bitcoin holders, the recent price action is a cause for celebration. The vast majority of those who have adopted a buy-and-hold strategy are now seeing huge profits, reinforcing the adage that patience pays in the world of cryptocurrency investing.

                  Has the Bitcoin Bull Run Only Just Begun?

                  As we approach the much-anticipated Bitcoin halving in April 2024, the landscape is ripe with opportunity for those looking to invest in Bitcoin, especially in light of recent developments in the Bitcoin ETF space that are adding fuel to the fire in a way never seen before in financial history. 

                  For those looking for an indicator of what might be to come, the introduction of the gold ETF in 2004 provides a glimmer into what we might expect.

                  Average annual gold price after first US gold ETF was approved
                  Average annual gold price after first US gold ETF was approved

                  The convergence of Bitcoin’s historic first ever pre-halving all-time high, the advent of ETFs, and the impending halving event paint a bullish picture for the future of Bitcoin. 

                  For investors willing to adopt a long-term perspective, the current period offers a strategic entry point into the world of Bitcoin investment. As the market evolves and matures, the potential for significant returns for early adopters remains high.

                  As always, this article does not constitute financial advice. You should be sure to do your own research and consult a professional financial advisor before making a major investment decision.


                  To stay up to date on all things crypto, like Xcoins on Facebook, and follow us on Twitter, Instagram, TikTok, and LinkedIn.

                  Subscribe to our newsletter