


Plan B’s Seven Charts to Watch for 2024
As we edge closer to the much-anticipated Bitcoin halving in April 2024, investors and enthusiasts are keenly analyzing trends and predictions to make informed decisions.
The event, known for its significant impact on Bitcoin’s value, presents a unique opportunity for those looking to invest in Bitcoin.
This article delves into seven charts highlighted by legendary Bitcoin analyst Plan B that shed light on Bitcoin’s potential trajectory leading up to and following the halving, offering valuable insights for those planning to buy Bitcoin.
Understanding the Stock-to-Flow Model: Plan B’s 2024 Price Prediction
The Stock-to-Flow (S2F) model has long been a powerful tool for predicting Bitcoin’s value. According to Plan B’s latest analysis posted on Youtube, it suggests a substantial increase in Bitcoin’s price post-halving, projecting a value of approximately $532,000 by 2025.
This model highlights the cyclical nature of Bitcoin’s price movements in relation to halving events, underscoring the potential for significant gains.
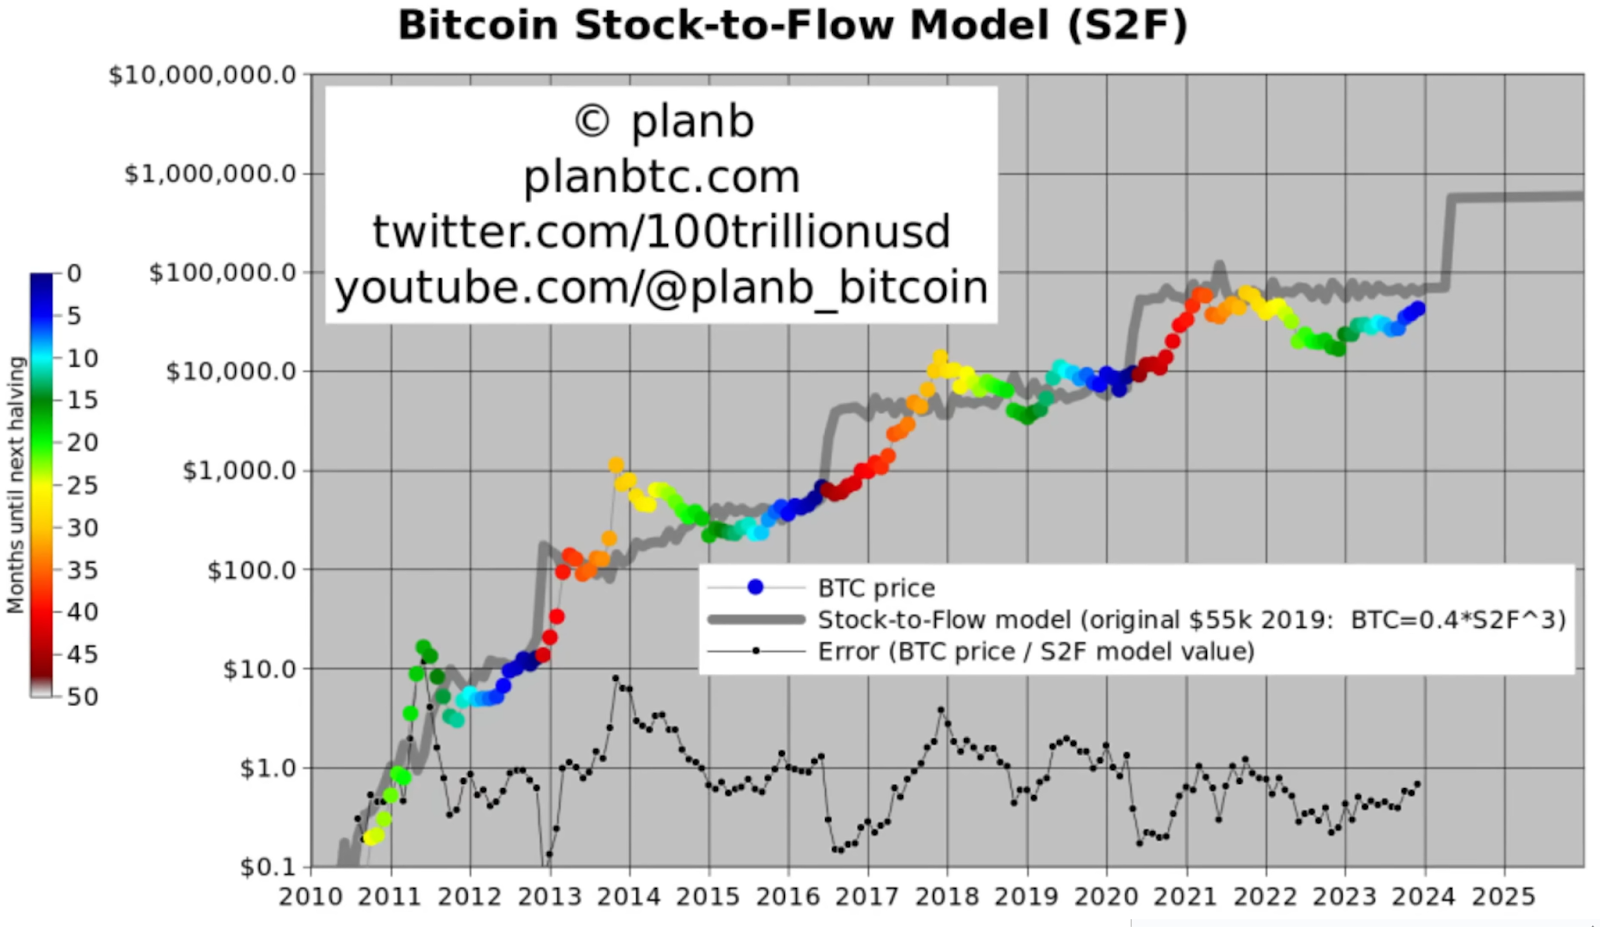 Plan B’s Stock-to-Flow Model via Plan B on Youtube
The S2F model points to the halving events as catalysts for price increases, with historical data showing jumps in value coinciding with past halvings.
As the scarcity of Bitcoin doubles after every halving, the model anticipates a gradual but steady price increase, rather than an immediate spike, suggesting a prime window for investors to buy Bitcoin in the run-up to a Bitcoin halving.
The Bitcoin Market Cycle: An Indicator of What’s to Come
The Bitcoin Market Cycle model provides a broader perspective on Bitcoin’s phases, indicating that we are currently in an accumulation phase. This phase typically precedes a bull market, signaling a potentially lucrative period for Bitcoin investors.
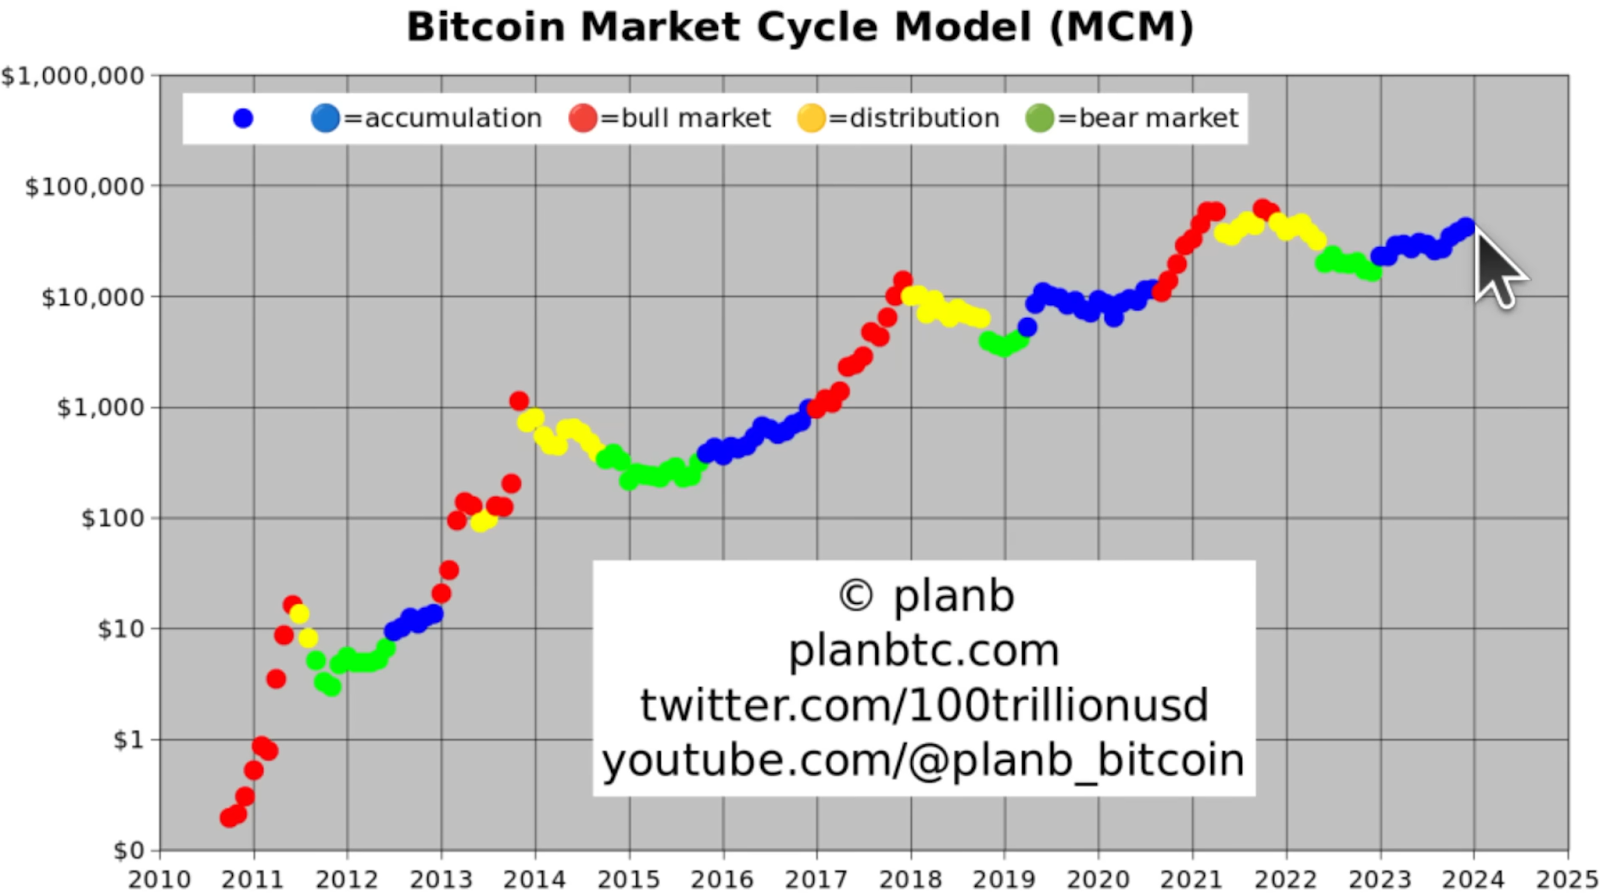 Bitcoin Market Cycle Chart via Plan B on Youtube
This model reinforces the S2F predictions, indicating that while past bull markets have yielded up to 100x returns, a more conservative yet substantial 10x increase is anticipated in the forthcoming cycle, aligning with the S2F’s bullish outlook.
Technical Analysis: Momentum and Moving Averages
Technical analysis charts, such as the Relative Strength Index (RSI) and Moving Average (MA), offer insights into Bitcoin’s current momentum and potential future movements. The RSI suggests an uptrend towards the halving, with Bitcoin’s price expected to rise steadily.
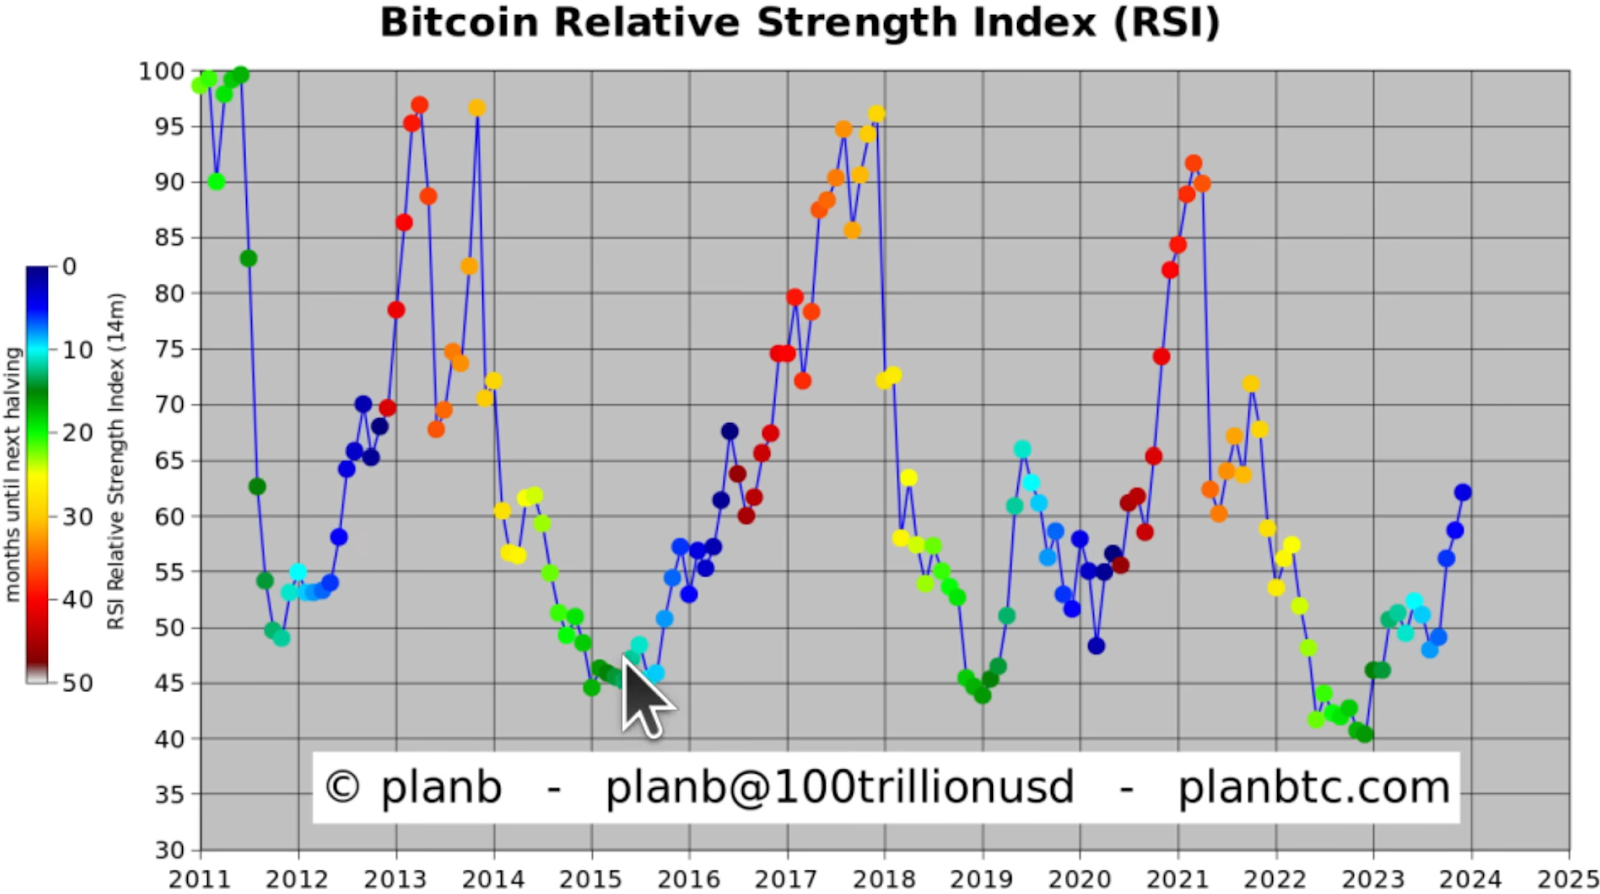
Relative Strength Index (RSI) Chart via Plan B on Youtube
Similarly, the 200-week MA indicates a consistent upward trajectory, with halving events typically resulting in prices 2X above this average. This consistency across technical indicators provides a compelling argument for investing in Bitcoin pre-halving.
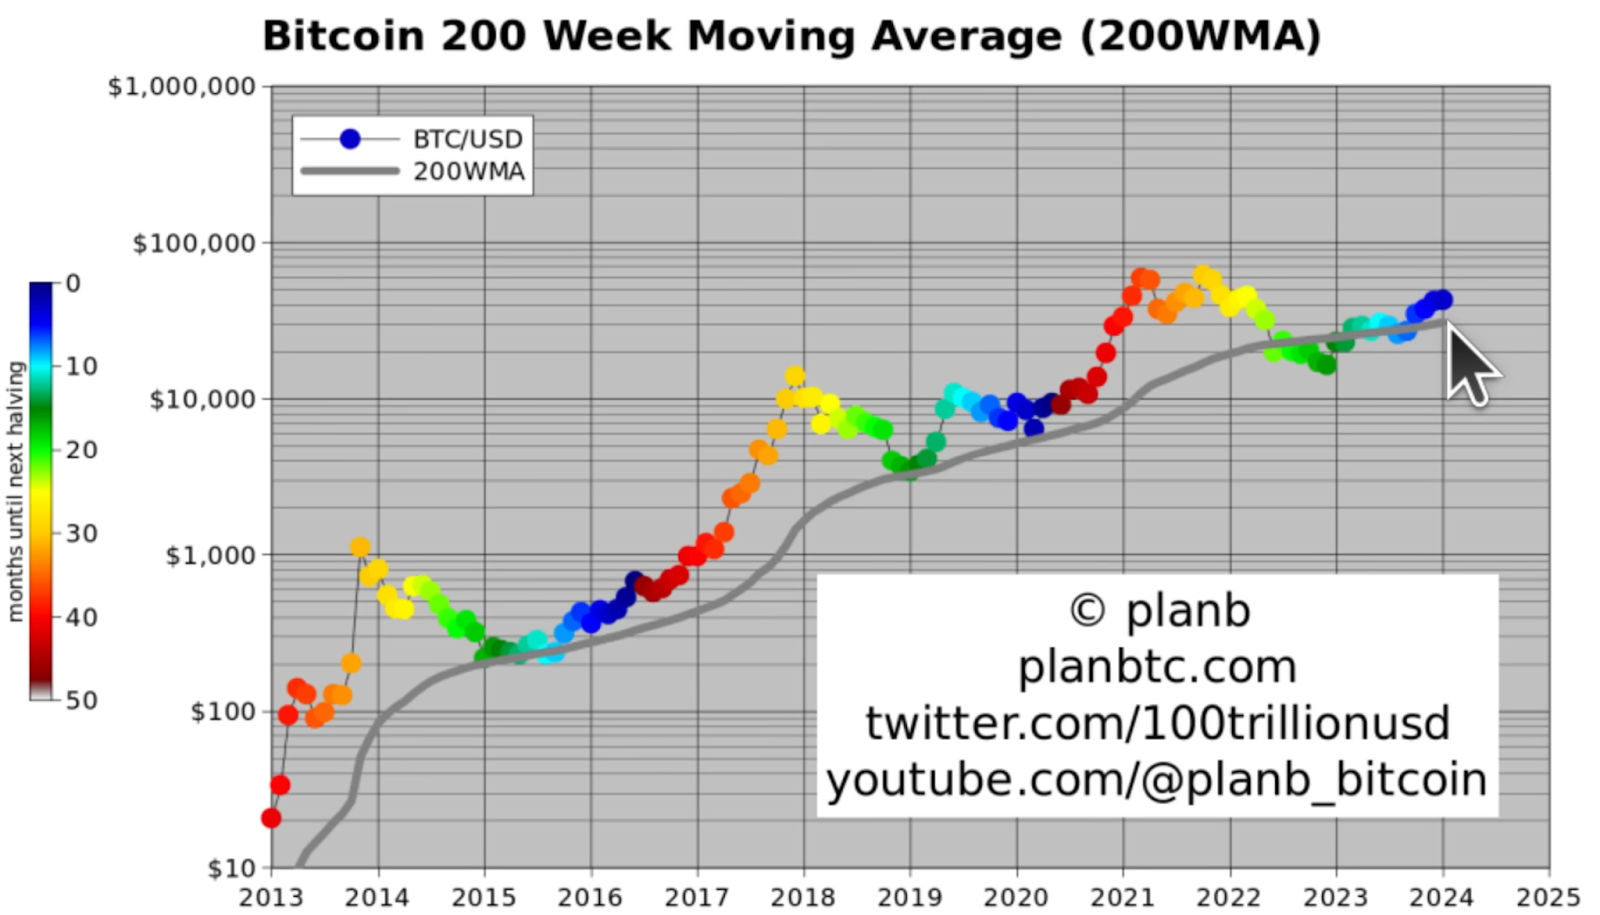 200 Week Moving Average (MA) Chart via Plan B on Youtube
On-chain Data: Realized Price and Profit Analysis
On-chain data, particularly the realized price, offers a unique perspective on Bitcoin’s valuation. This metric, representing the average cost price of all Bitcoin, suggests that we’ve exited a bear market and are entering a bullish phase, further supported by the fact that almost 90% of all Bitcoin is currently in profit.
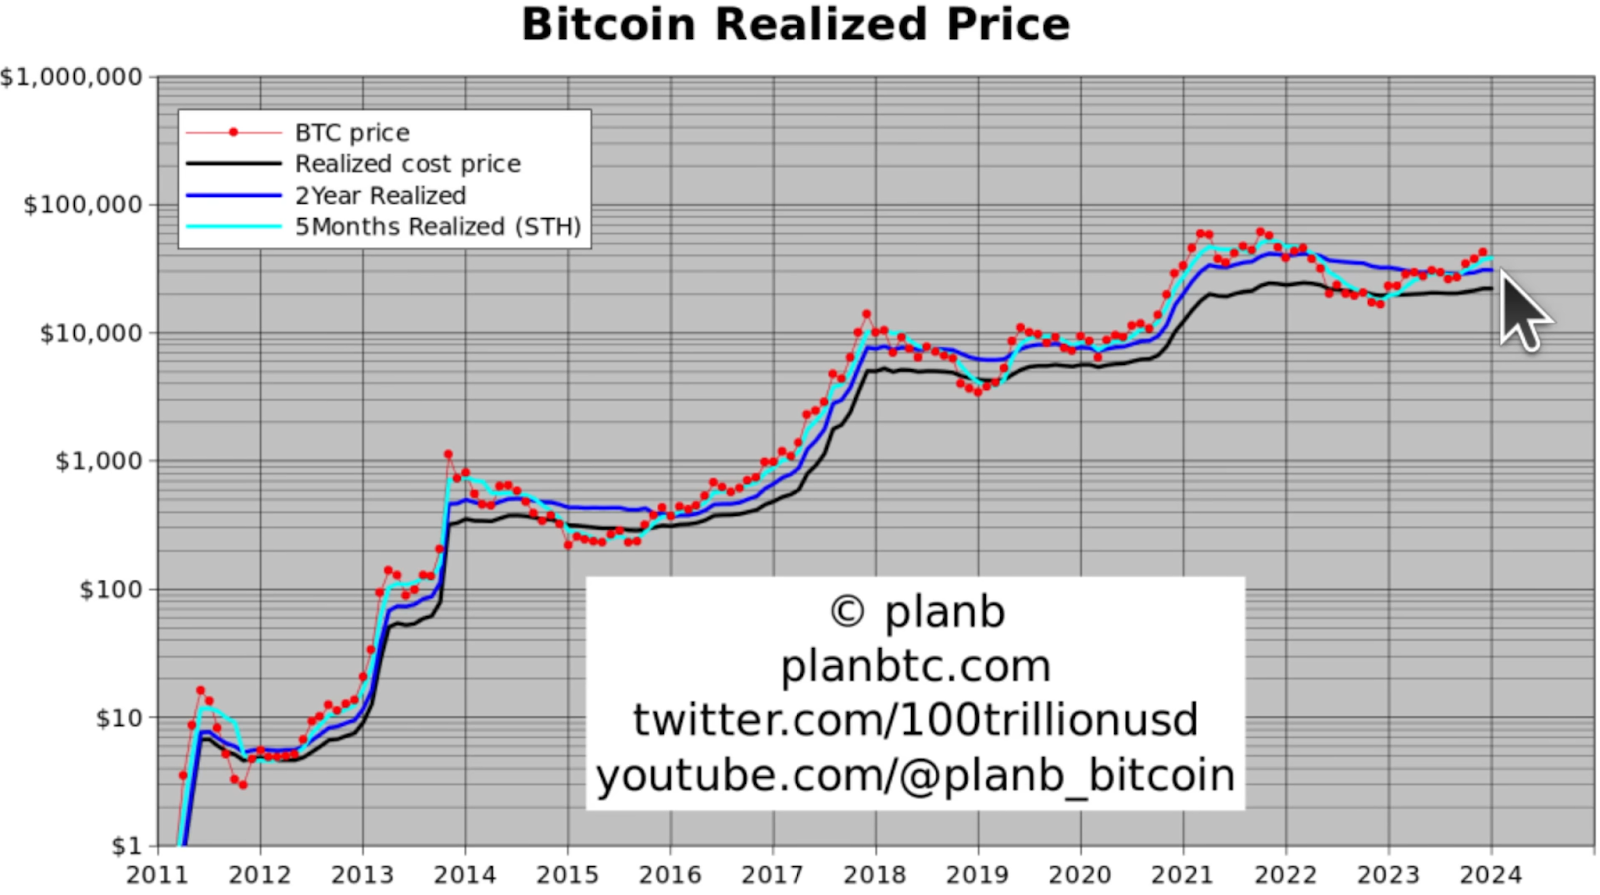 BTC Realized Price Chart via Plan B on Youtube
This bullish signal is corroborated by historical patterns, where periods of profit typically precede significant market upturns, reinforcing the potential for substantial gains post-halving.
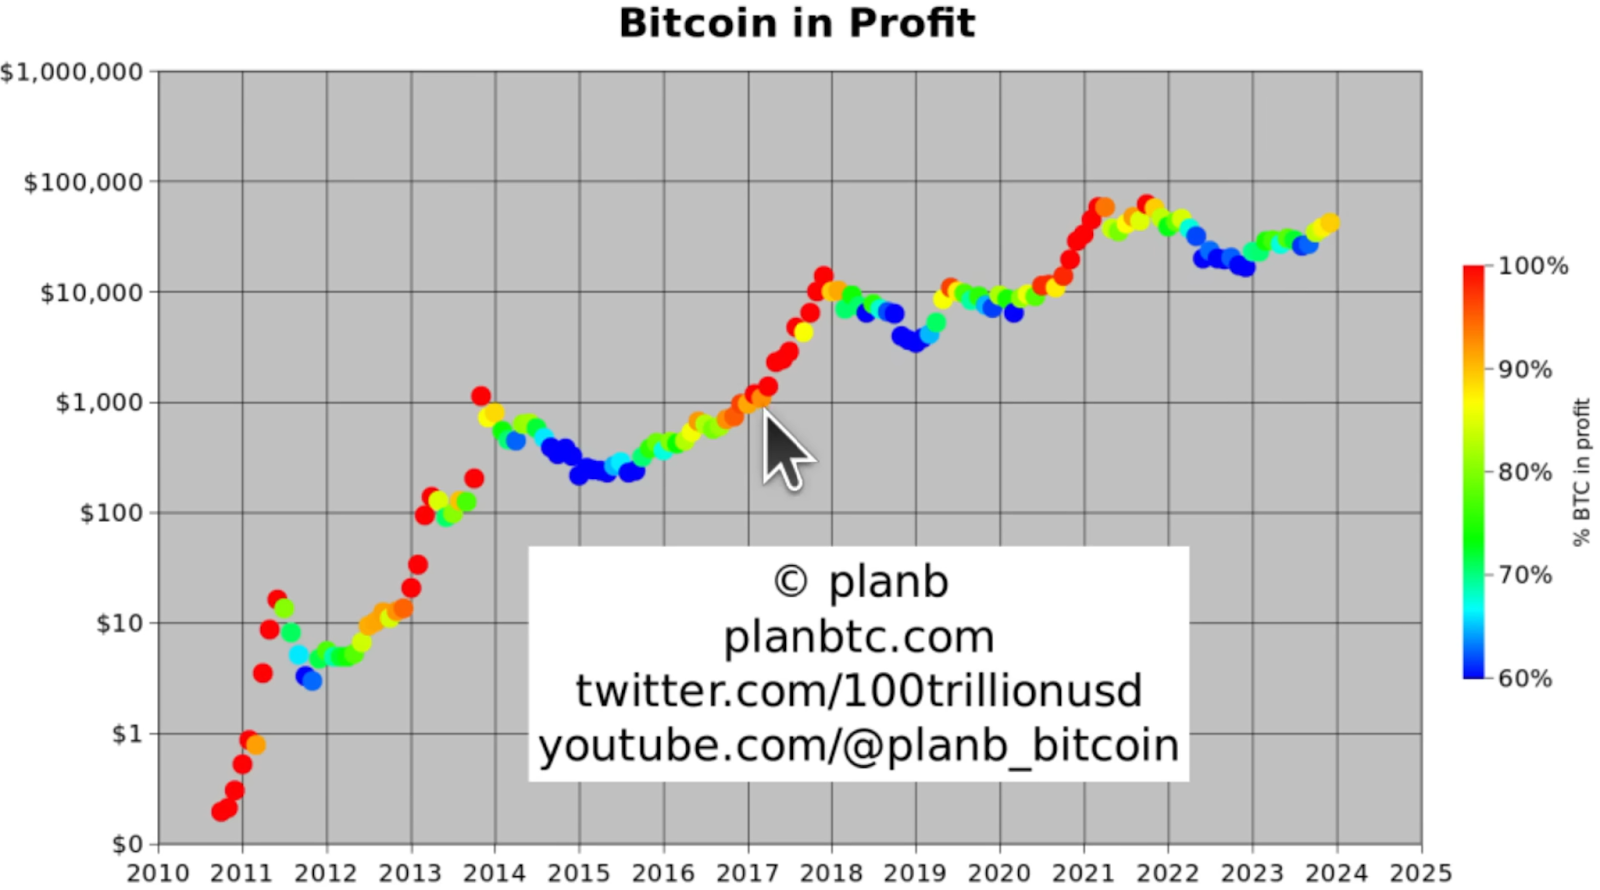
BTC in Profit Chart via Plan B on Youtube
The Trading Rule: A Strategic Approach to Bitcoin Investment
A proposed trading rule suggests buying Bitcoin in the six months before the halving and selling in the 18 months after. This strategy has historically aligned well with Bitcoin’s price cycles, offering a structured approach to maximizing returns.
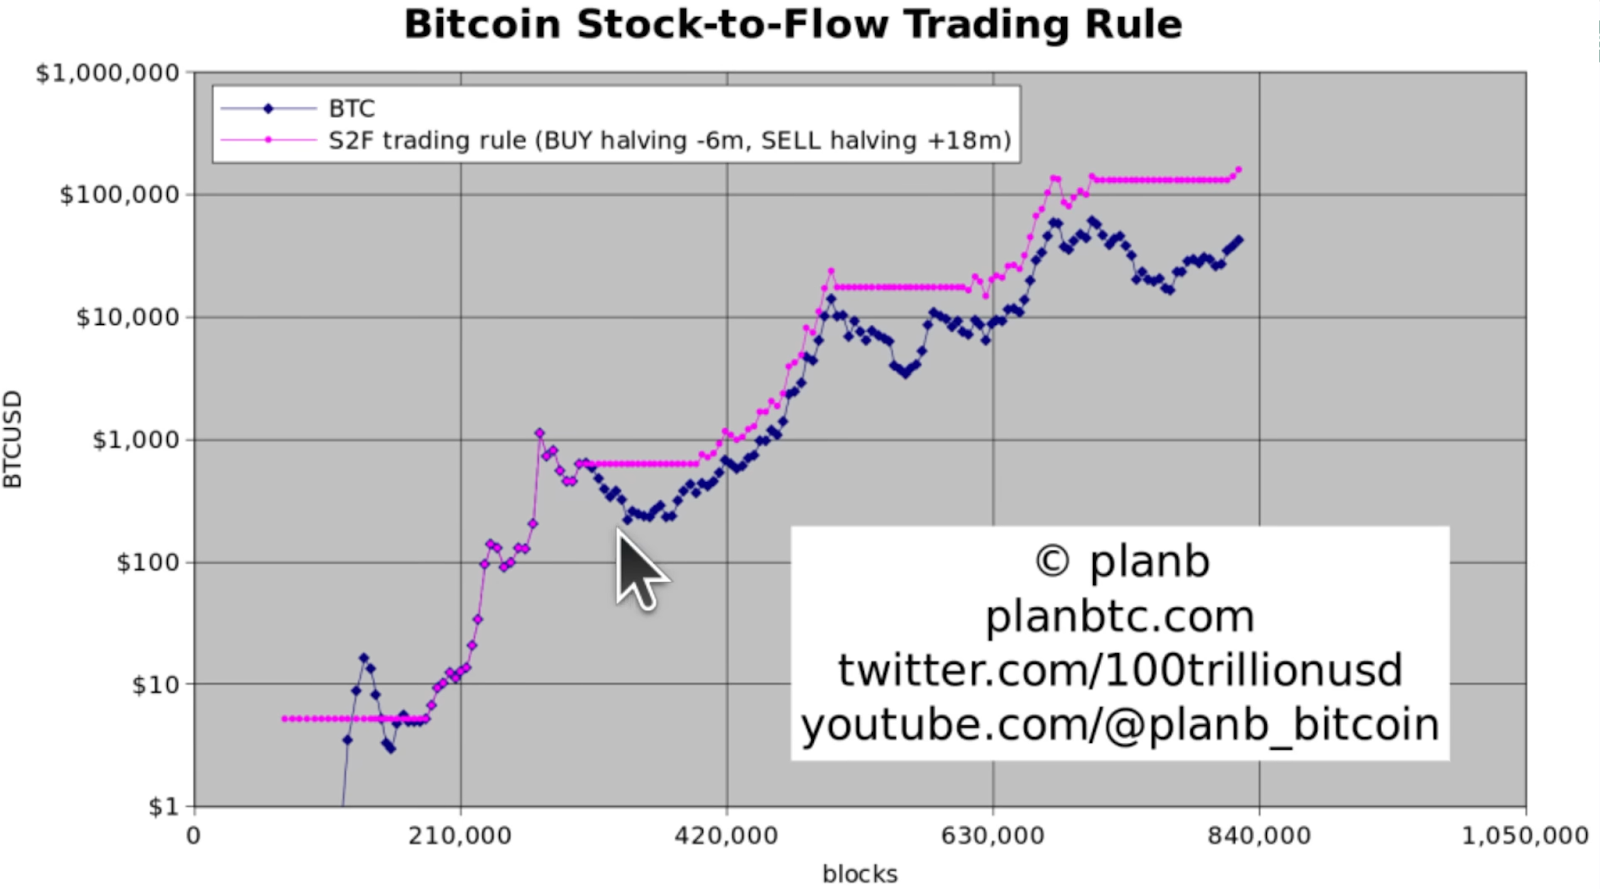 Trading Rule Analysis Chart via Plan B on Youtube
As we approach the halving, this rule implies a prime investment window, with the potential for considerable growth in the subsequent 18 months, highlighting the strategic importance of timing when choosing to buy Bitcoin.
The Time to Act is Now
The confluence of predictions and analyses across these seven charts presents a compelling case for investing in Bitcoin before the April 2024 halving.
While the market is inherently volatile and predictions are not guarantees, the data suggests a significant opportunity for growth.
For those considering buying Bitcoin, the period leading up to the halving represents a strategic window to invest, with potential for considerable returns in the following years. However, as with any investment, it’s crucial to conduct thorough research and consider personal financial situations before making decisions.
As always, this article does not constitute financial advice. You should be sure to do your own research and consult a professional financial advisor before making a major investment decision.
To stay up to date on all things crypto, like Xcoins on Facebook, follow us on Twitter, Instagram, LinkedIn, and sign up at the bottom of the page to subscribe.