

Why Plan B Expects Bitcoin to EXCEED the Stock-to-Flow Model this Cycle
The long-awaited Bitcoin bull run has officially begun, according to the famous analyst Plan B and his stock-to-flow model.
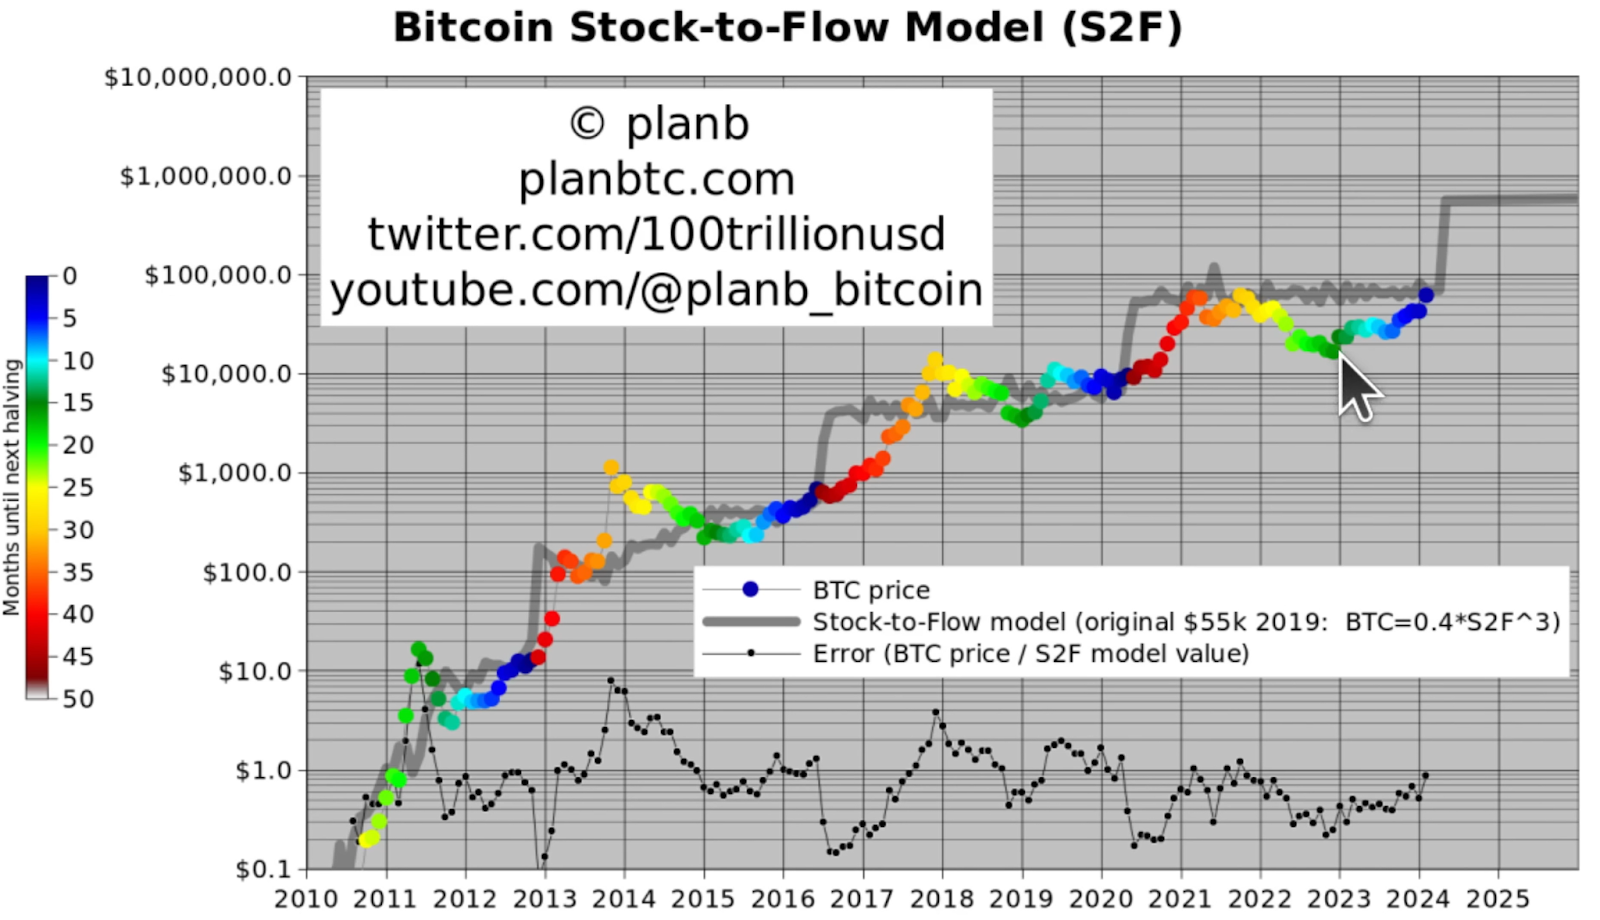
Plan B is now expecting Bitcoin to break through and vastly exceed the stock-to-flow model’s upside in this cycle, just as it has done historically after periods of underperforming the model.
The stock-to-flow model had been criticized as “broken” when Bitcoin prices were depressed below the model’s values in 2022. However, this is a pattern seen before, with Bitcoin eventually blowing past the model’s expectations as a new bull phase takes hold.
With only days to go until the next halving in April 2024, now could be an optimal time to buy Bitcoin before it potentially goes stratospheric.
Historically, steep Bitcoin gains have followed in the wake of these halving events as new supply is cut in half, putting upwards pressure on the price.
When Will the Bitcoin Top Arrive?
Based on past cycles, Plan B predicts the peak of this Bitcoin bull run will likely occur in 2025, not 2024 as many analysts are anticipating.
He anticipates Bitcoin will begin rising strongly after the halving event in April 2024, but with a slight delay as was seen in previous halvings.
The “Red Dot” marking the start of the bull phase has now flashed on Plan B’s charts. This signals we have officially transitioned from the accumulation phase to a bull market phase, according to Plan B.
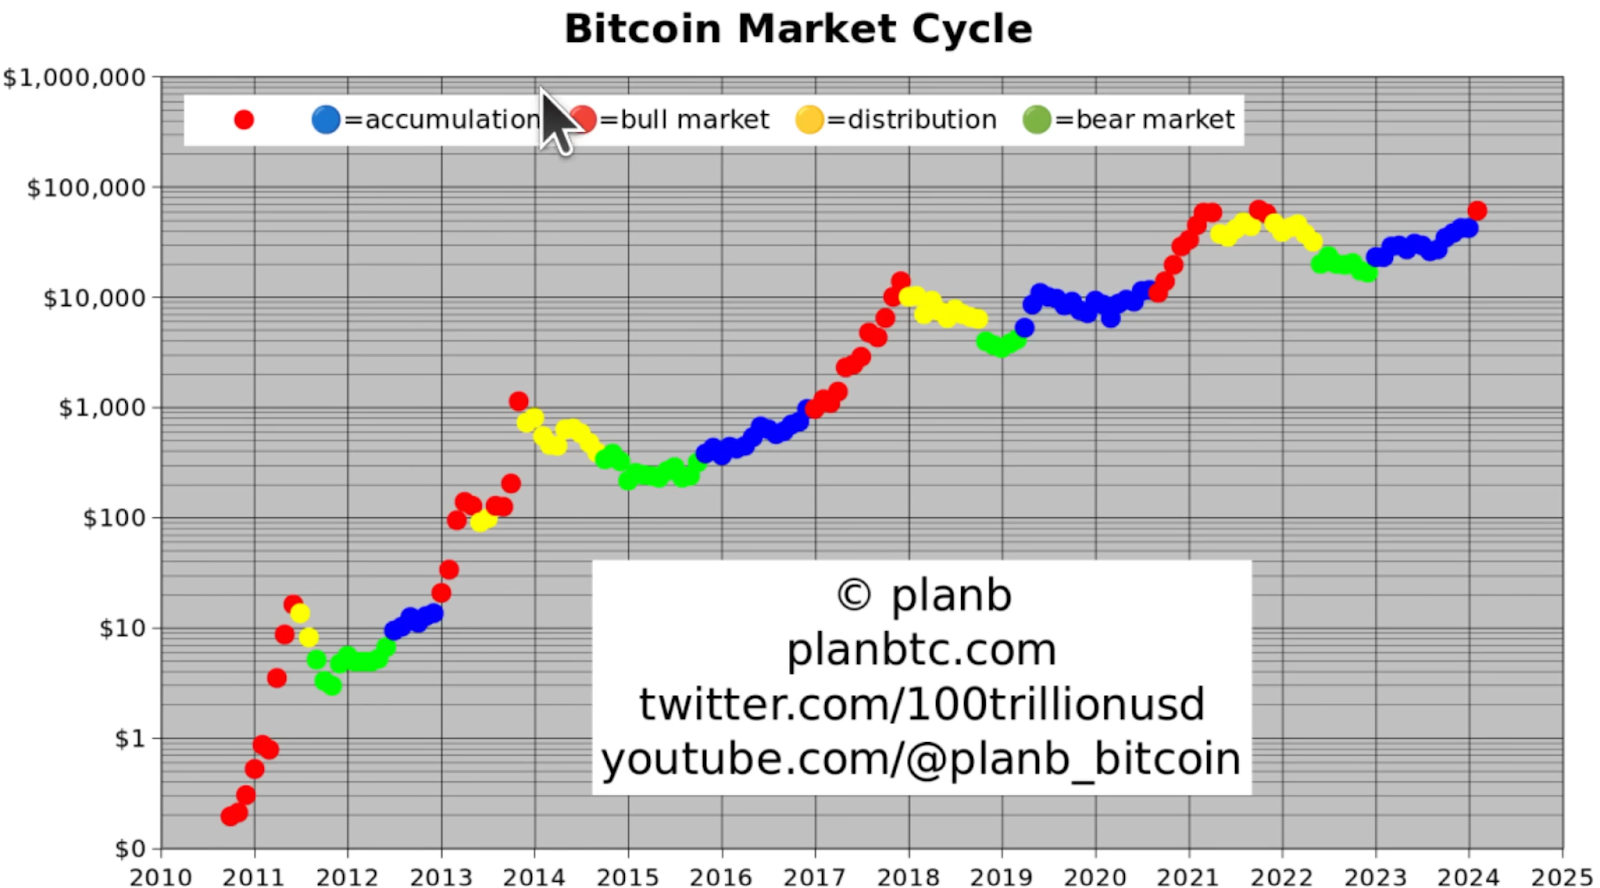
A bull market phase for Bitcoin is characterized by “face-melting FOMO, extreme price pumps, and multiple -30% dips” according to Plan B.
The volatile conditions can be scary for those unfamiliar with Bitcoin’s cyclical bull markets. However, the analyst advises staying calm and not panic-selling during any incoming 30% dips, as they have been commonplace after past peaks.
In the 2017 bull run for example, there were around 5-6 separate drawdowns of over 30% before new highs were established.
Thanks to improved fundamentals like the Bitcoin ETF launches drawing billions in institutional inflows, we could expect even more extreme price action in this cycle compared to 2017 and 2021.
How High Could Bitcoin Go?
Plan B’s charts reveal incredibly bullish signs that suggest Bitcoin has a long runway ahead in this cycle.
The Relative Strength Index (RSI), a closely-watched technical indicator, recently hit 73. This is nearing the overbought levels of 90-100 that were sustained in past bull runs during periods of buyer euphoria.
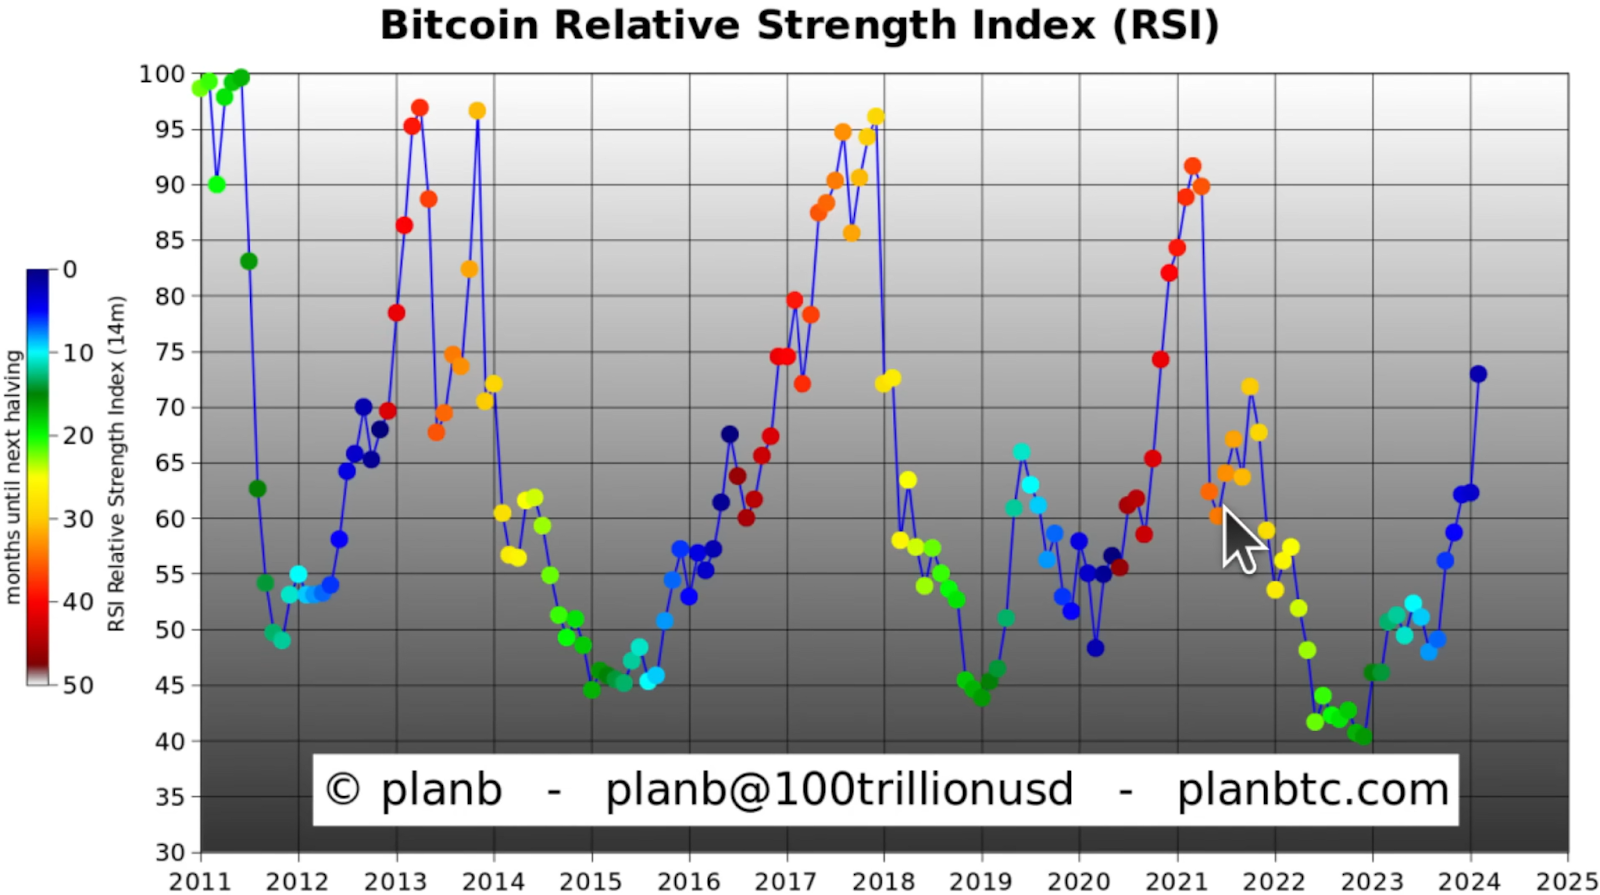
While a high RSI can precede short-term pullbacks, Plan B notes that in a bull market, RSI readings of 60-70 can persist for extended periods as prices continue grinding higher.
This is a stark difference from traditional equities markets where RSIs over 70 are considered strongly overbought. Bitcoin has a history of experiencing those very extended overbought conditions during its wildest upswings.
More importantly, Bitcoin is now trading well above all of its key moving averages and realized prices from historic buyer levels. This indicates there is a lack of strong resistance overhead as nearly all holders are in profit and unwilling to sell at current levels.
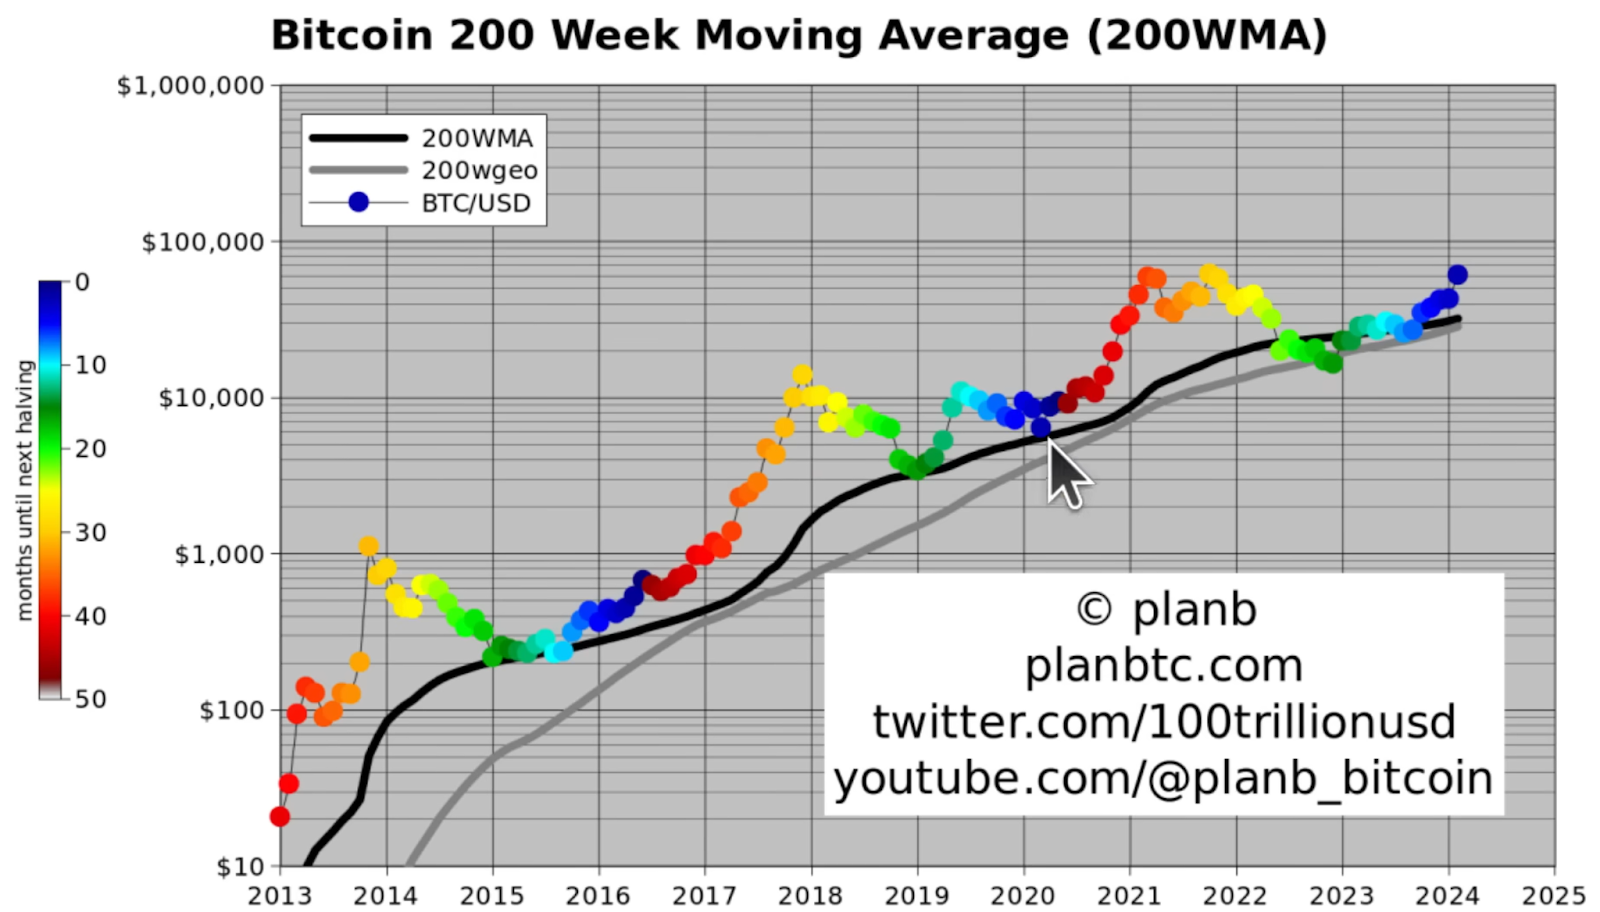
The 200-week moving average of around $32,000 should act as a “floor” that will not get breached on monthly closes according to Plan B.
More critically, he stated Bitcoin may “never again” trade below the $49,000 short-term holder realized price.
The data suggests that if you buy Bitcoin before the halving in April 2024, you could be well-positioned to capture exponential gains as this cycle’s bull run driven by the advent of institutional adoption potentially eclipses previous cycles.
Bitcoin is a revolutionary asset with a finite supply capped at 21 million coins. As new supply issuance is cut roughly in half every four years, upwards pricing pressure is typically applied in the year or two following these halving events.
With Wall Street finally warming up to Bitcoin through vehicles like ETFs, and sovereign nation states exploring digital currency options, the fundamental investment case for Bitcoin has arguably never been stronger heading into the 2024 halving.
As always, this article does not constitute financial advice. You should be sure to do your own research and consult a professional financial advisor before making a major investment decision.
To stay up to date on all things crypto, like Xcoins on Facebook, and follow us on Twitter, Instagram, TikTok, and LinkedIn.