

11 Charts That Are Bullish for Bitcoin
The past few months have been challenging for the crypto markets, to say the least. We have seen a market decline that has led to one of the largest losses in value in the history of Bitcoin.
The great crypto crash of 2022 came in three waves, first we had the successive hits of raising interest rates as the macro economy awoke with a jolt from the pandemic slumber that had been artificially pumping crypto prices. Next, we saw the collapse of Luna, as TerraUSD, then the third-largest stablecoin, and the largest algorithmic stablecoin, imploded in the same week. Next we saw the collapse of FTX, then the second-largest centralized crypto exchange in the world, due to what may pan out to have been one of the largest frauds in financial history.
But Bitcoin’s core fundamentals remain unchanged, Bitcoin hodlers that self-custody (as we here at Xcoins have always strongly advised) haven’t lost a single sat. DeFi activity has exploded, and the on-chain data paints a clear picture. It suggests that the Bitcoin bottom may be close, potentially providing a rare opportunity for investors with a long-term mindset to pick up a bargain.
Bitcoin adoption is at an all-time high
Bitcoin use is soaring higher despite its volatility in the past few months which was exacerbated by the $10B alleged fraud by FTX.
Only 2017 surpassed the current pace of growth in addresses with more than 0.1 Bitcoin, and the number of addresses containing over a tenth of a bitcoin has never been higher than it is today. More and more people are locking away thousands of dollars worth of Bitcoin.
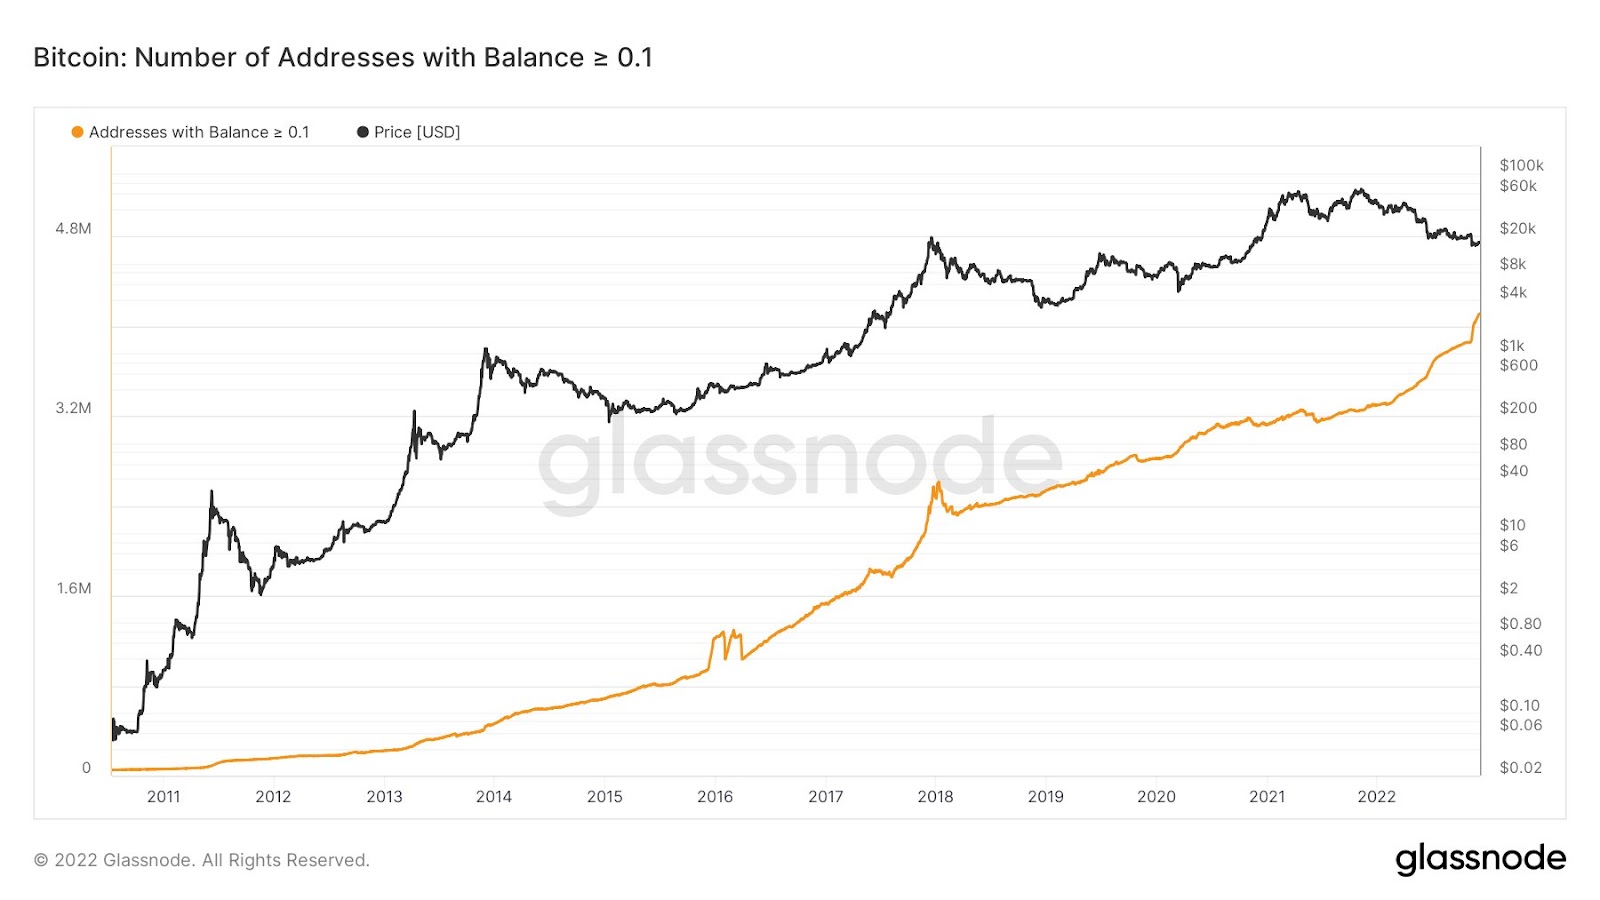
Graph Displaying the Number of Bitcoin Addresses with balances greater than or equal to 0.1.
Furthermore, institutional registrations on Bitstamp increased by 57% in November and are still growing. This shows that institutional traders are continuing to enter the market despite the recent downtrend.
The price of bitcoin just fell below the cost of producing it
In only four recorded periods in history has the price of Bitcoin fallen below the cost of electricity globally. Each of these windows has been a historical floor price for Bitcoin and appears to have been an amazing buying opportunity in hindsight.
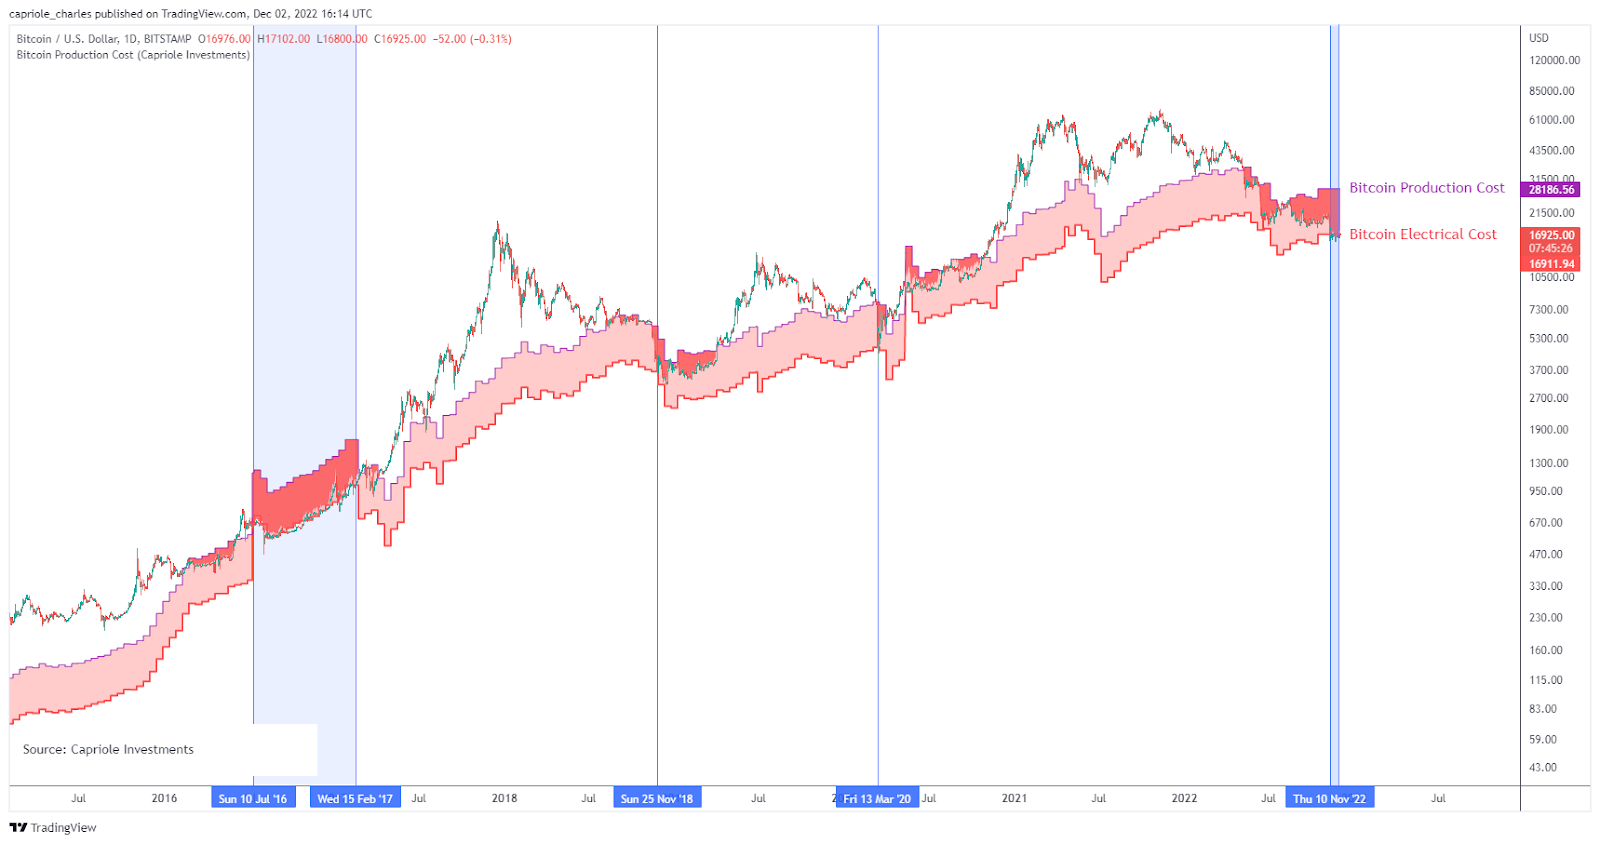
A graph showing the connection between the price of electricity and the cost of producing bitcoin.
Bitcoin miner selling pressure is at the 3rd highest of all time
Only in 2011 at a price of $2, and in 2015 at a price of $290 did Miner selling stress reach higher levels.
The market value of Bitcoin rose dramatically afterward both times. Will history repeat itself?
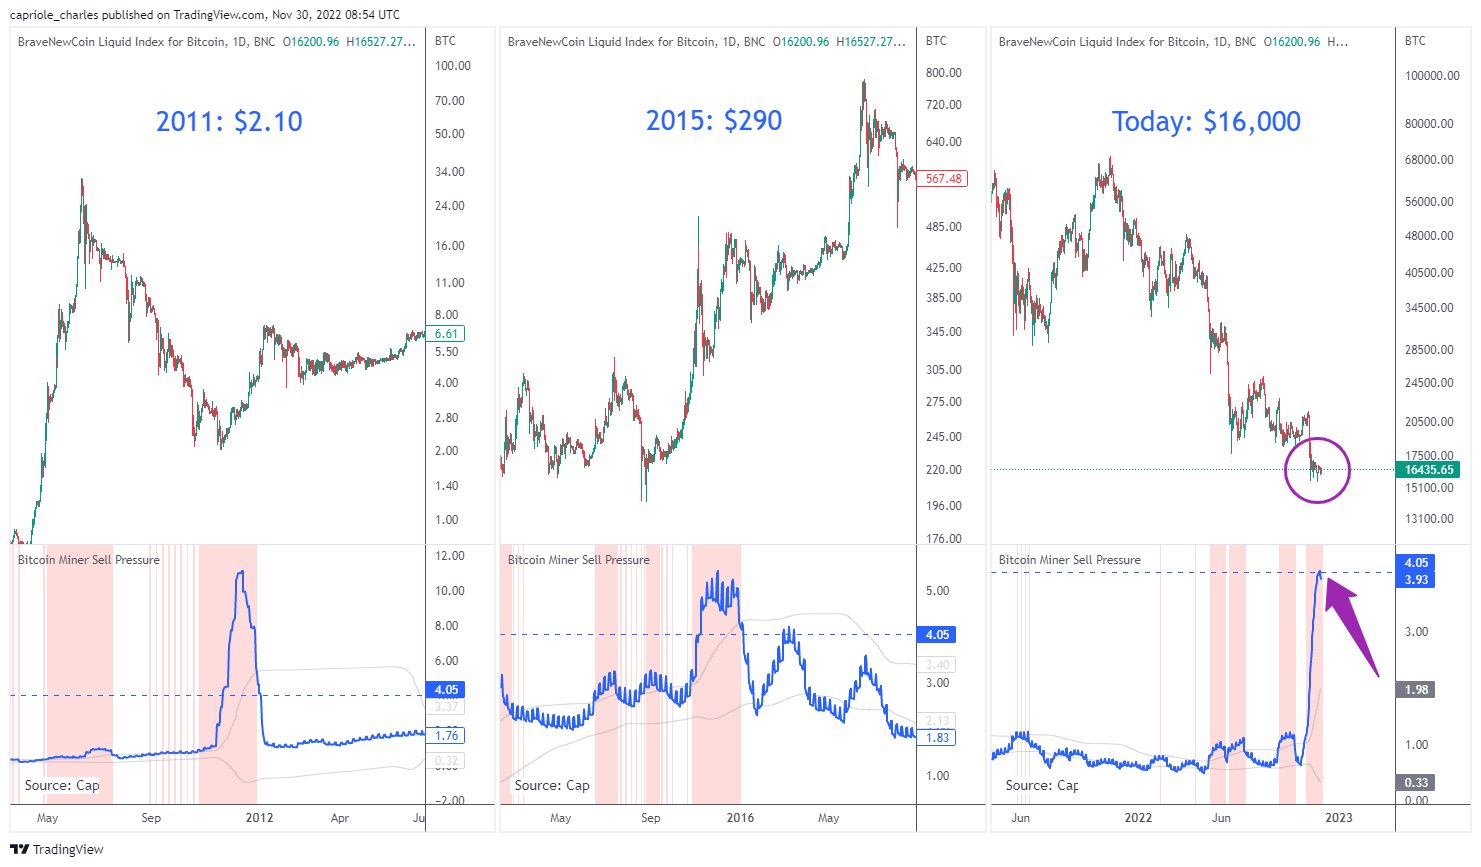
An image depicting the pressure on bitcoin miners to sell in 2011, 2015, and 2022.
Bitcoin miners are turning off their mining rigs
The confirmation of a miner capitulation by the Hash Ribbons Indicator is great news for those who are looking for the right time to “buy the dip”. This event is widely seen as a deep value signal, indicating that the price of Bitcoin is hitting a floor. “This is perhaps the best performing long-term buy signal for Bitcoin”, says leading Bitcoin analyst, Charles Edwards.
During a miner capitulation, many miners may sell their holdings of Bitcoin at a loss, leading to a drop in the overall price of the cryptocurrency. However, this dip in price is typically seen as a buying opportunity by those who believe in the long-term value of Bitcoin. In fact, some experts believe that a miner capitulation can mark the low point in the price of Bitcoin, making it an ideal time to buy.
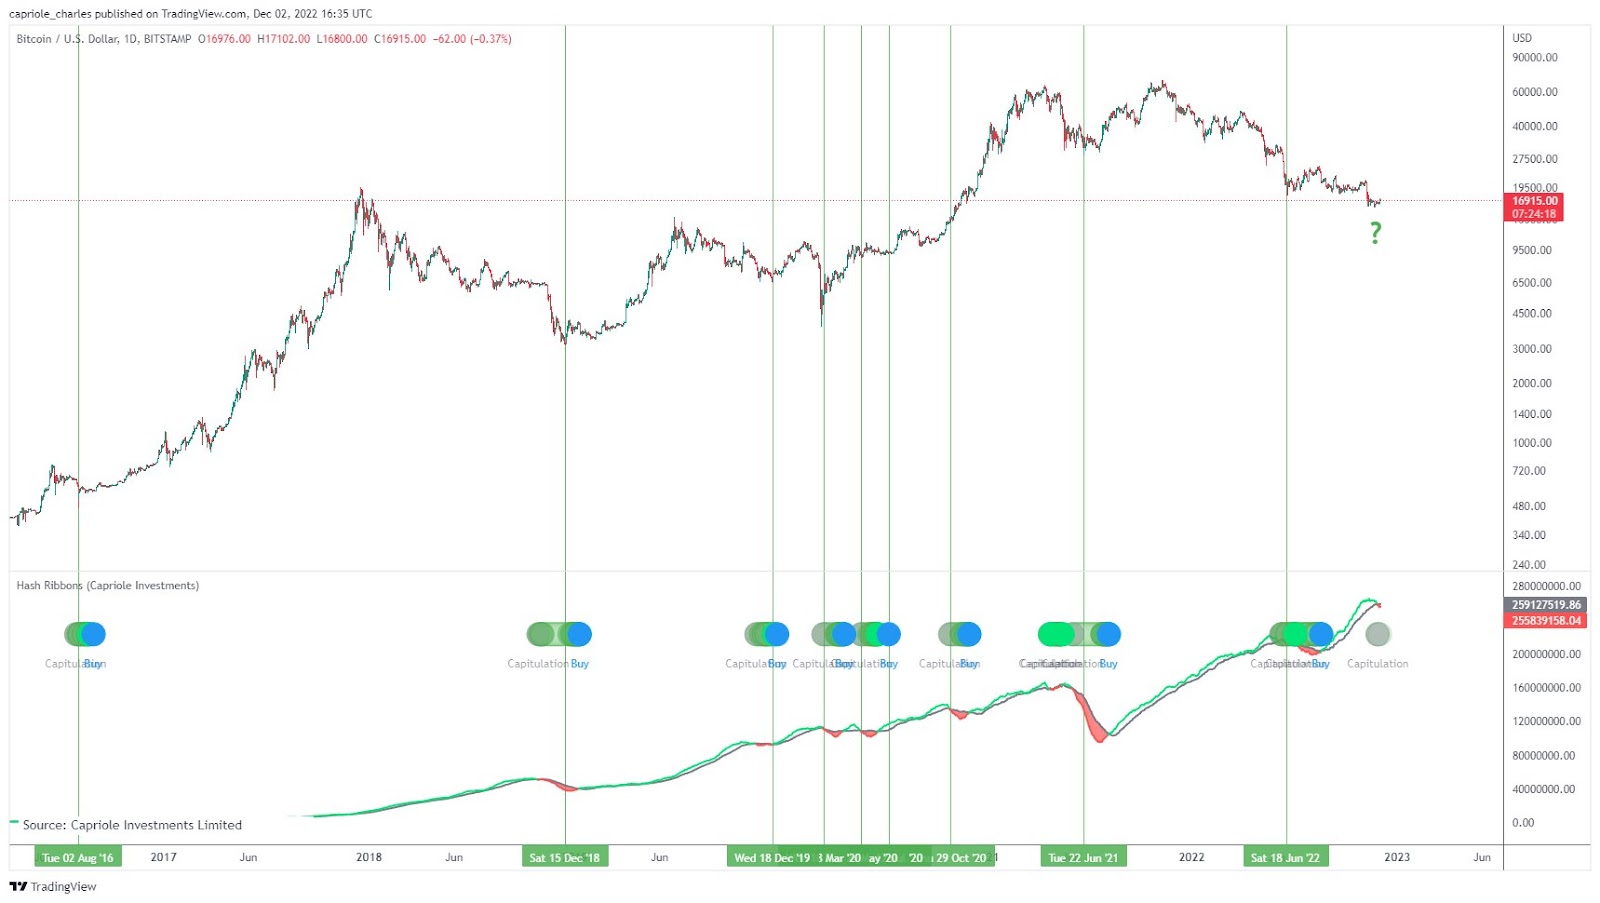
A chart illustrating miner capitulations since August 2019.
SLRV ribbons indicate that Bitcoin has crossed into Bullish territory
SLRV Ribbons are a popular on-chain metric used to determine the bullish or bearish sentiment of a market. Recently, the indicator crossed into bullish territory, indicating that Bitcoin may be entering a bullish phase.
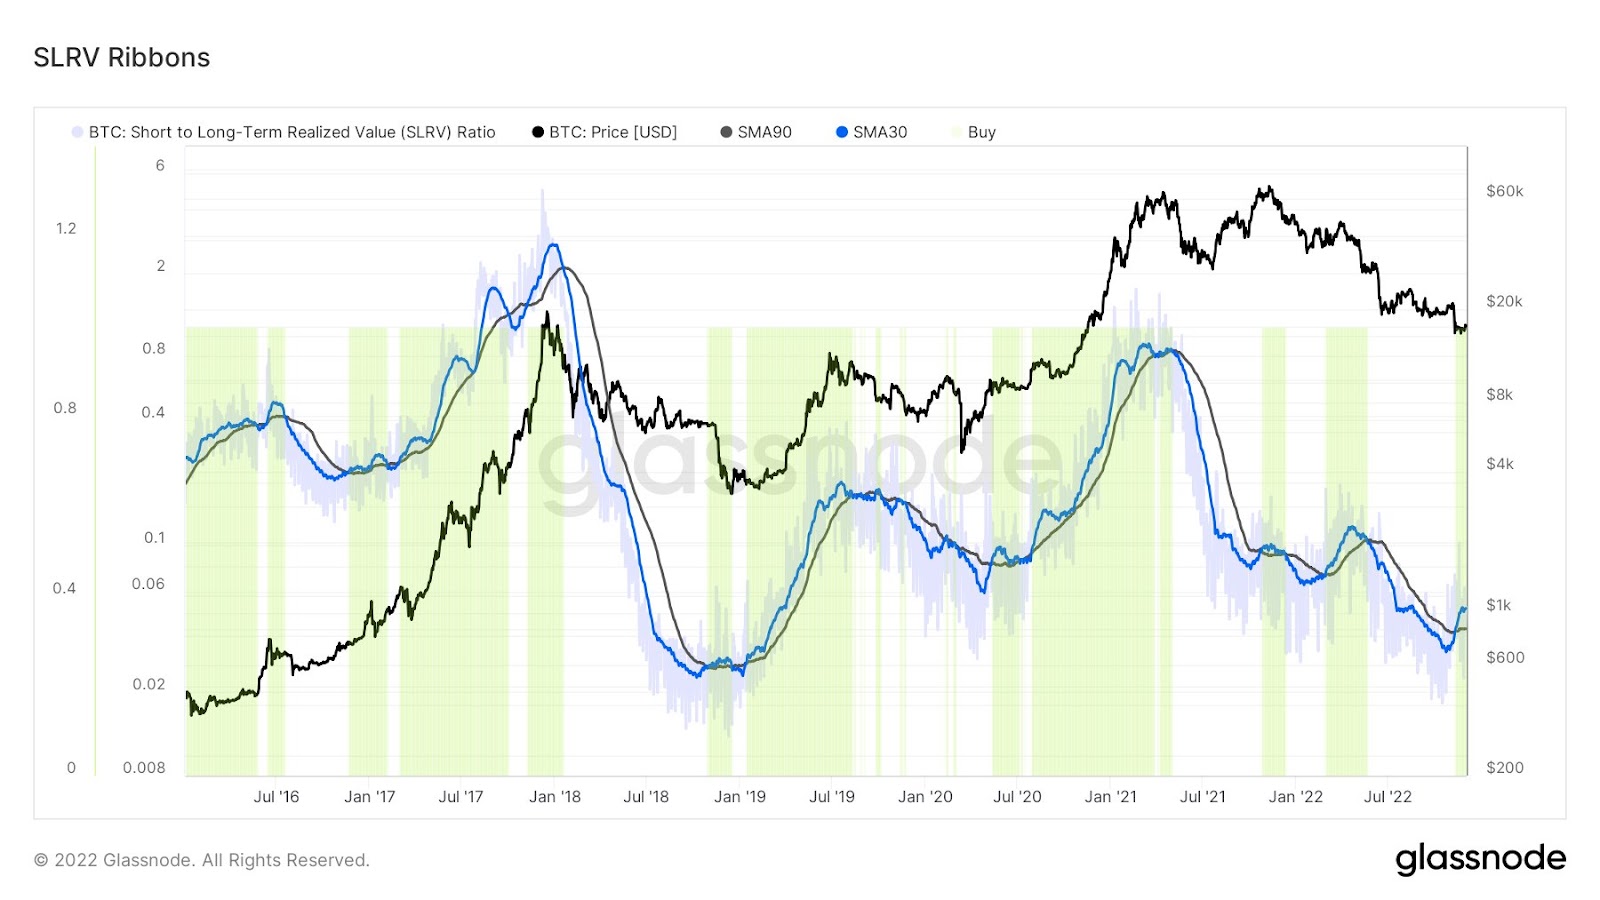
A chart displaying SLRV Ribbons indicator for Bitcoin from July 2016.
Dormancy Flow has been at all-time lows for much of the last few months
On-chain researcher David Puell has argued that whenever the dormancy value of a cryptocurrency overtakes its market capitalization at its lowest longitudinal levels, the market can be considered to be in full capitulation, presenting a historical buy zone.
In other words, the current state of Dormancy Flow may be a sign of deep value and now may be a good time to buy according to this metric. While only time will tell if this view is correct, historically, dormancy flow has been an indicator worth taking into account.
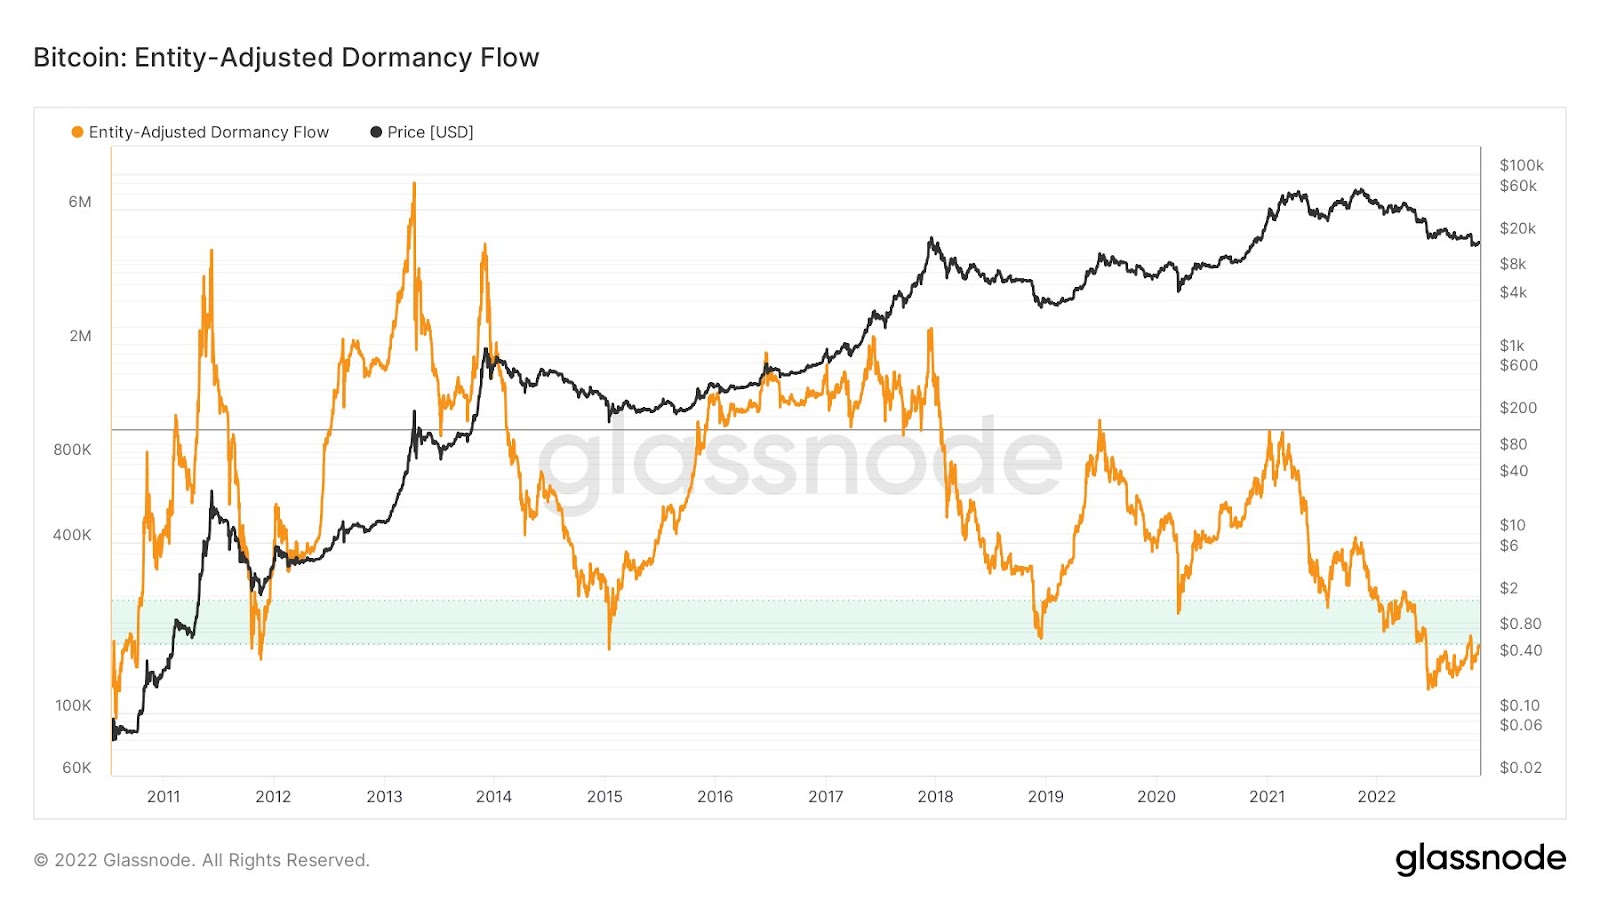
A chart showing the Entity-Adjusted Dormancy Flow of Bitcoin from 2011 through 2022 via Glassnode.
There is growing long-termism in Bitcoin investors
According to Glassnode’s most recent data, the long-term holding of Bitcoin is at an all-time high right now. According to the data, those who have been keeping their Bitcoin for at least one year now represent more of the network than ever before, with 66% of all Bitcoin now being held for over a year.
This is a significant development, as previous peaks in the long-term holding of Bitcoin have coincided with bear market troughs. This suggests that those who are currently holding onto their Bitcoin for the long term are confident in the future of the cryptocurrency, even in the face of an extended and deep bear market. It remains to be seen whether this confidence will be justified, but it is certainly a positive sign for those who believe in the long-term potential of Bitcoin.
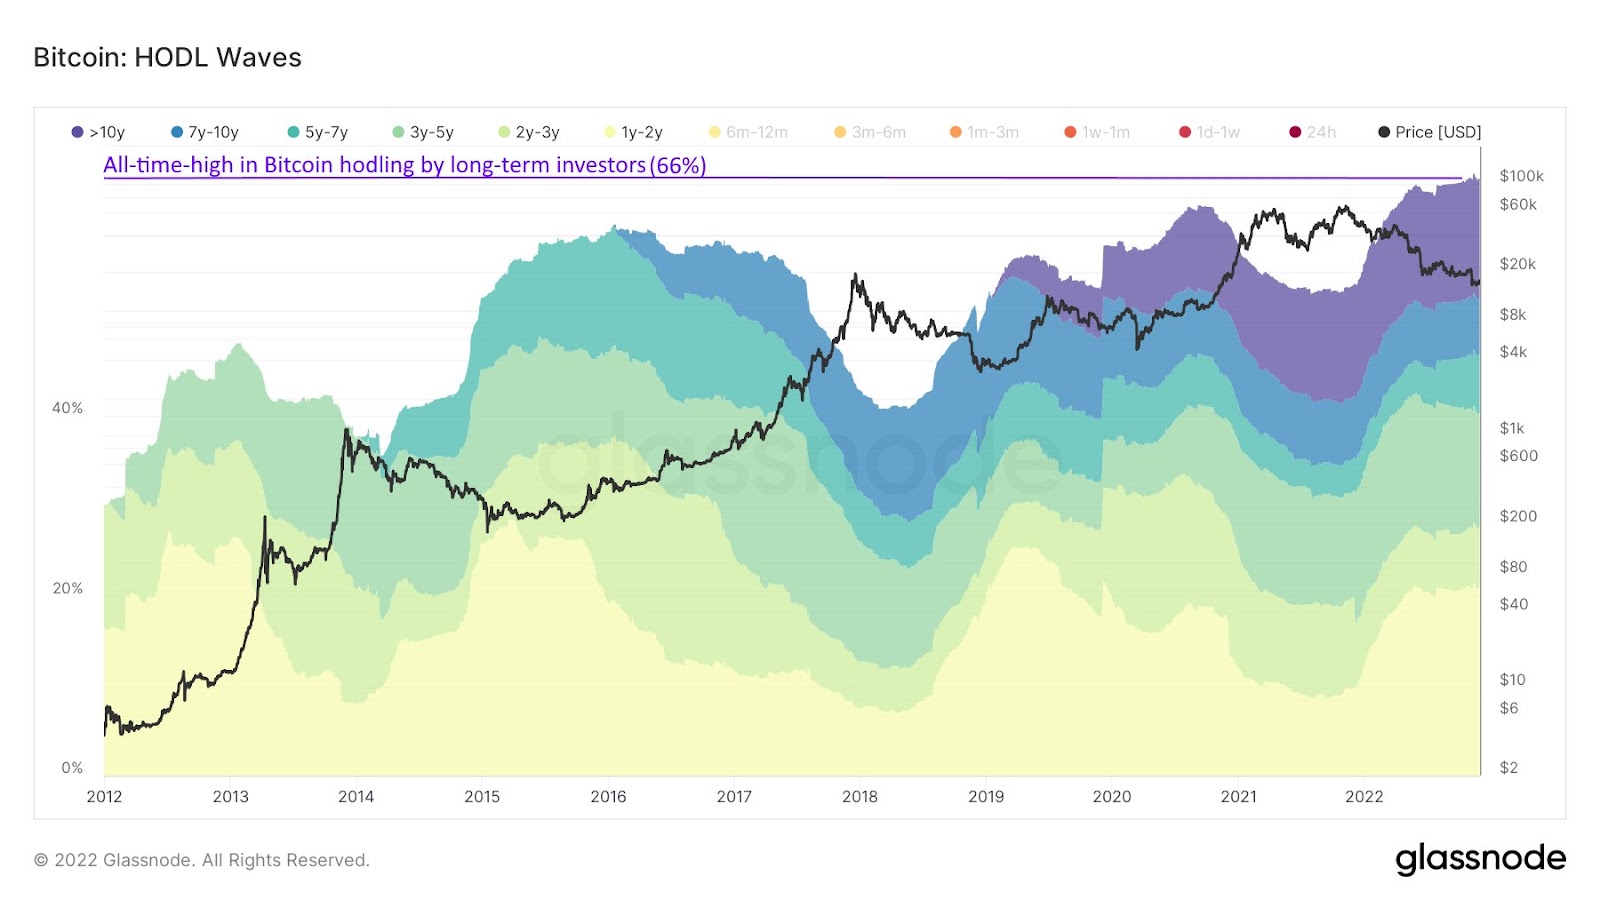
A chart showing the rate of Bitcoin hodling by long term investors from 2012 through 2022.
High profitability rate for Long-term holders
Holders of Bitcoin are currently experiencing a deep downdraw. A downdraw is a period of sustained decline in the price of a cryptocurrency and can be a challenging time for those who are holding onto their digital assets for the long term.
In the case of Bitcoin, downdraws have previously hit their lowest levels during mid points of halving cycles, with declines of up to -80% being observed.
While it is always possible for the price of Bitcoin to go lower, long-term holder NUPL (Net Unrealized Profit/Loss) is a key indicator to watch for those hoping to buy the dip.
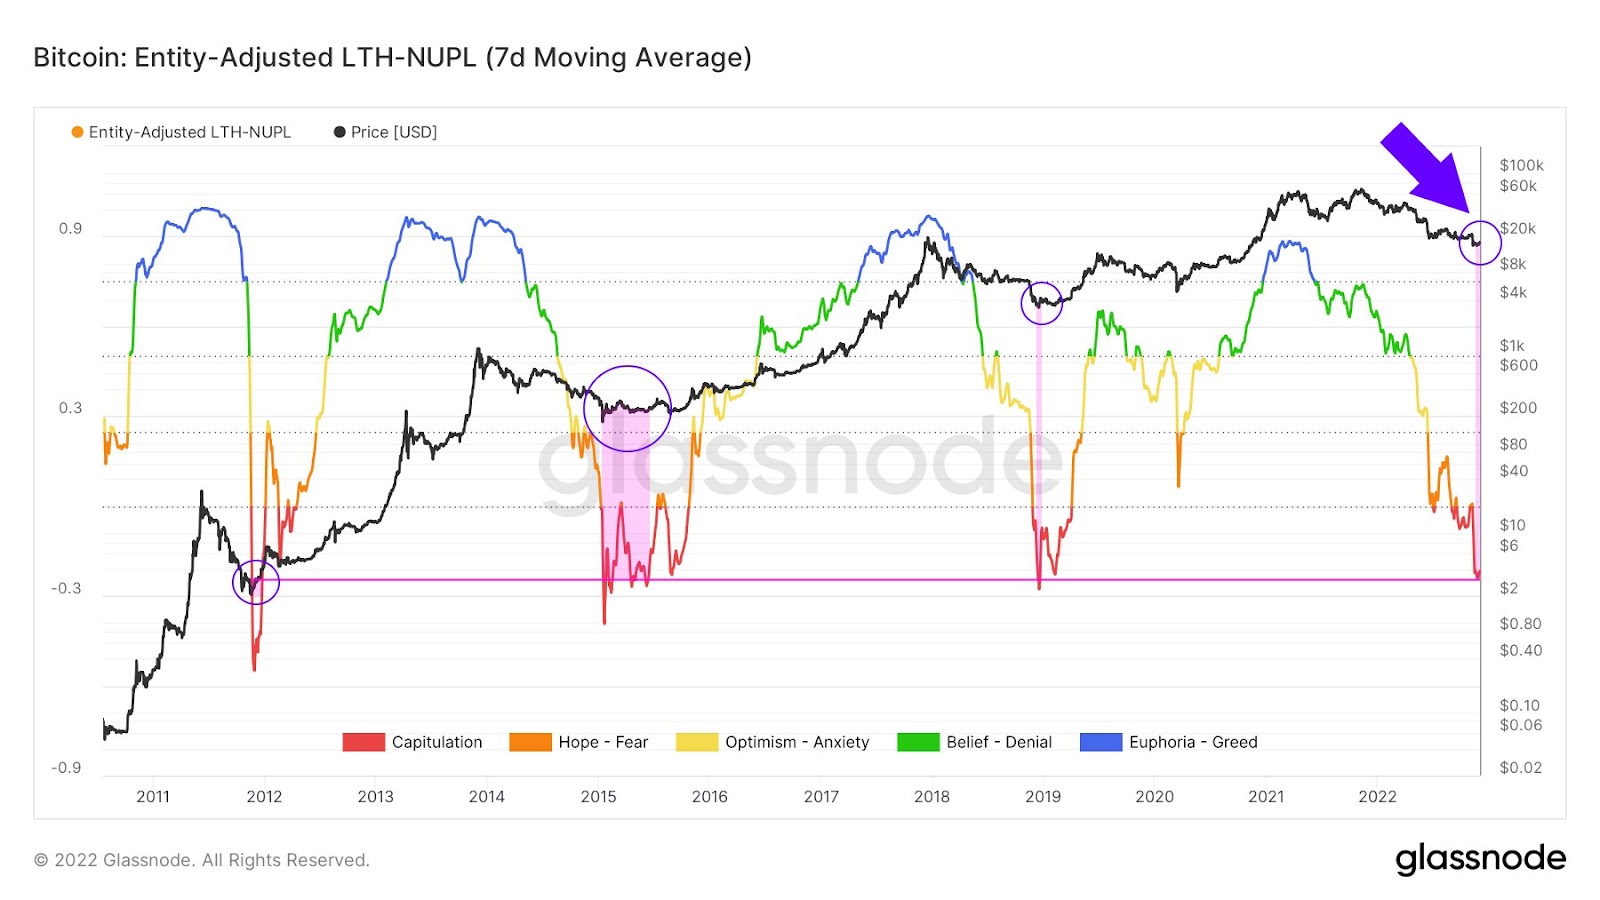
Chart showing the Bitcoin NUPL from 2011 to 2022.
Investors are parking dry powder in Stablecoins
The growing amount of money parked in stablecoins like USDC and USDT suggests that the cryptocurrency market is more hedged than ever before.
Stablecoins are digital assets that are pegged to the value of a stable asset, such as the US dollar, and are often used as a way to protect against volatility in the broader market.
People using stablecoins like USDC and USDT are unlikely to be simply parking their savings in these digital assets and leaving the industry. Instead, they are using stablecoins as a way to keep funds at the ready to plunge into the next major rally.
It is probable that when the market improves, the money that is currently being saved in Stables will be used quickly to buy more cryptocurrencies.
This could lead to significant price increases for a wide range of cryptocurrencies, so Stables volumes will be worth watching closely in the coming weeks and months.
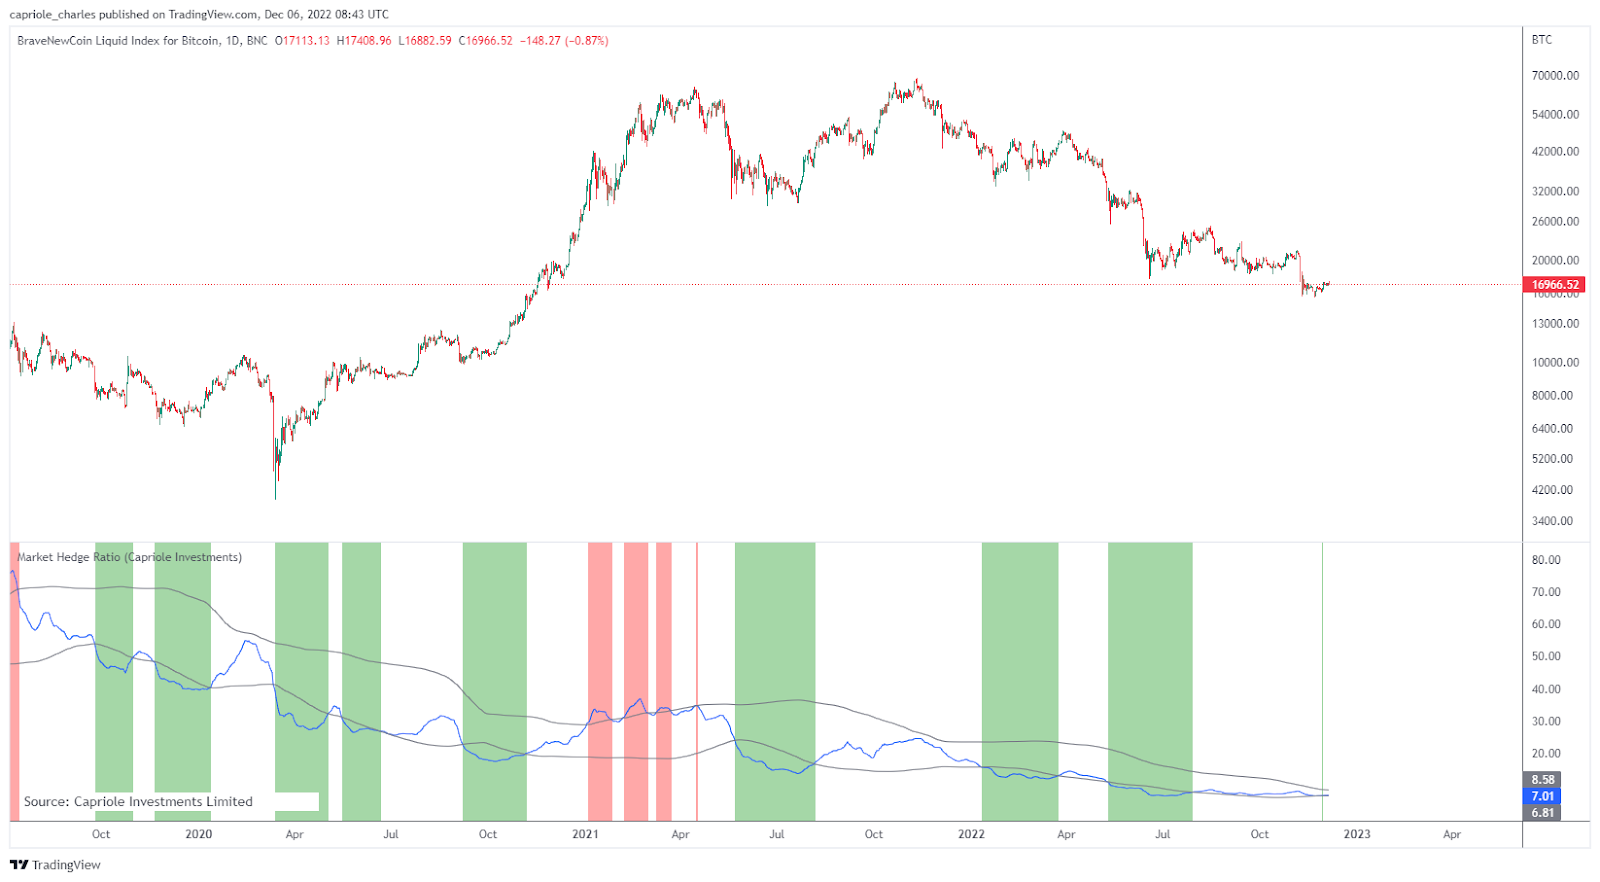
Market Hegde Ratio for Bitcoin.
Bitcoin is priced cheap when compared to its realized value
MVRV Z-Score is a bitcoin metric that uses blockchain analysis to identify periods of time where Bitcoin is extremely over or undervalued relative to its ‘fair value’.
The current MVRV Z-score suggests that Bitcoin’s current market price is priced incredibly cheaply compared to its Realized Value. Realized Value is a metric that takes into account the price at which each individual Bitcoin was last moved on the blockchain, providing a picture of the true value of the cryptocurrency in the minds of holders.
According to MVRV Z-score, the depth and duration of the current market downturn look uncannily similar to the prior cycle bottoms. This suggests that we may be approaching a potential bottom for the market, which could be a good time to buy for those who are bullish on the long-term potential of Bitcoin.
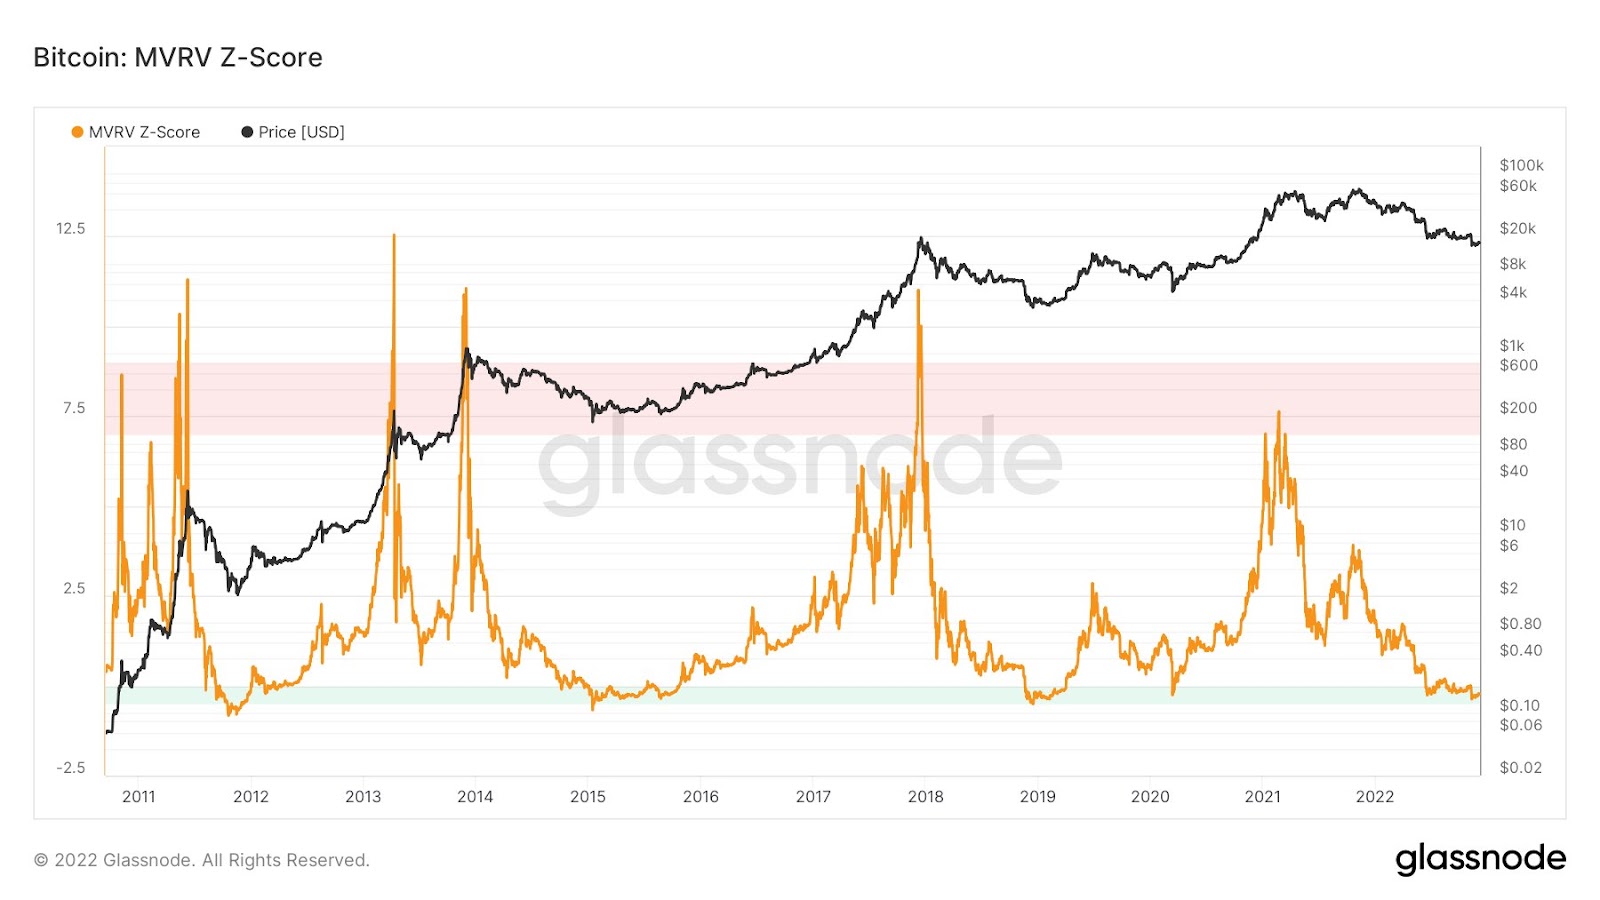
MVRV Z-score for Bitcoin from 2011 to date.
We are now at the centre of the bitcoin halving “bottom zone”
We are now situated right in the middle of the halving cycle bottom zone.
For every prior Bitcoin halving cycle there has been a value zone in between halvings when bitcoin has been at its cheapest.
It is worth noting that the bottom zone for each halving cycle is not an exact science, and the actual bottom can occur at slightly different times in each cycle. However, the general trend is clear: sentiment and prices tend to bottom out between halvings.
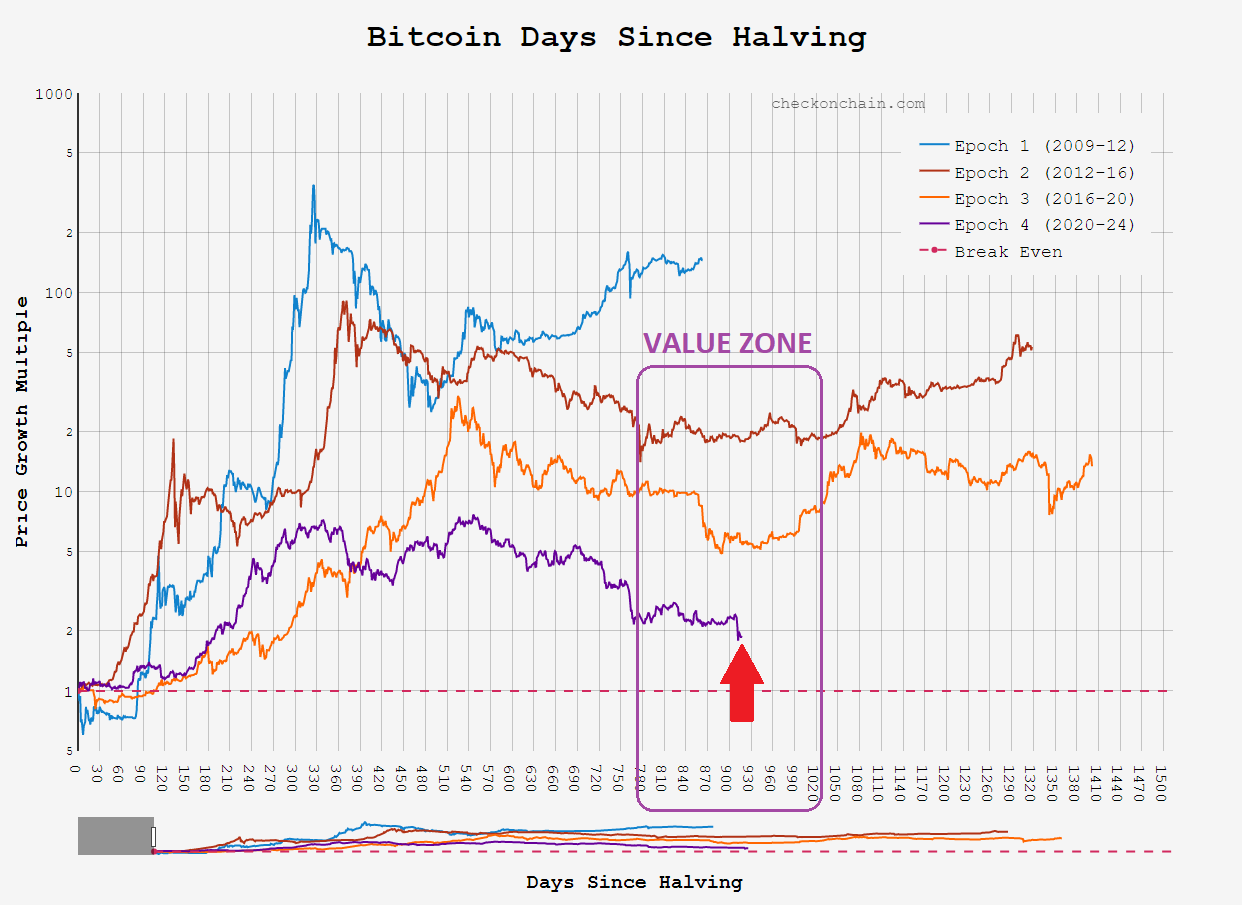
Chart showing bitcoin price patterns following each halving event.
Is Bitcoin analysis reliable?
On-chain analysis of bitcoin has been shown to be effective in the past, but it is crucial to consider the current macroeconomic environment when conducting such analysis, and always remember the fact that past performance doesn’t guarantee future gains.
The current macro environment, including ongoing energy crises, high interest rates, and the potential for economic recession mean crypto market cycles may not play out in exactly the same ways they have done before. While we can make our best guesses, it is impossible to predict the future, and every piece of bitcoin price analysis should be taken in conjunction with broader economic analysis and with a healthy pinch of salt.
But if you do choose to buy the dip, we recommend you use an exchange that sends you your crypto the minute you buy it. Like Xcoins.
As always, this article does not constitute financial advice and you should be sure to do your own research and consult a professional financial advisor before making a major investment decision.
To stay up to date on all things crypto, like Xcoins on Facebook, and follow us on Twitter, Instagram, and LinkedIn.