


Ethereum’s Current Landscape and Strategic Outlook: A Detailed Analysis
Quick Takeaways
- Ethereum (ETH) has demonstrated resilience after an 82% correction, with recent price movements suggesting a potential stabilization phase.
- The introduction of Ethereum Exchange-Traded Funds (ETFs) has broadened investor access, potentially increasing market liquidity and stability.
- Ethereum’s price broke through a critical resistance zone between 1985 and 2185 USDT, indicating renewed investor interest and setting the stage for future gains.
- Technical analysis highlights two potential scenarios: a major rebound from the current support zone or a less likely deeper correction due to external factors.
- The confluence of key technical indicators, including the trendline, support zone, and 61.8% Fibonacci correction, suggests Ethereum is at a critical juncture.
- Investors should remain vigilant, considering both technical indicators and broader geopolitical and macroeconomic factors, as Ethereum ETFs introduce new market dynamics.
Ethereum (ETH) has long been a cornerstone of the cryptocurrency market, serving as both a technological pioneer with its smart contract capabilities and a bellwether for broader market sentiment. As we move through 2024, Ethereum’s price movements and strategic implications are a focal point for investors, particularly in light of its recent performance and the introduction of Ethereum Exchange-Traded Funds (ETFs). This article will explore Ethereum’s recent market behavior, the impact of ETFs, and potential future scenarios based on current technical analysis.
Ethereum’s Performance Overview
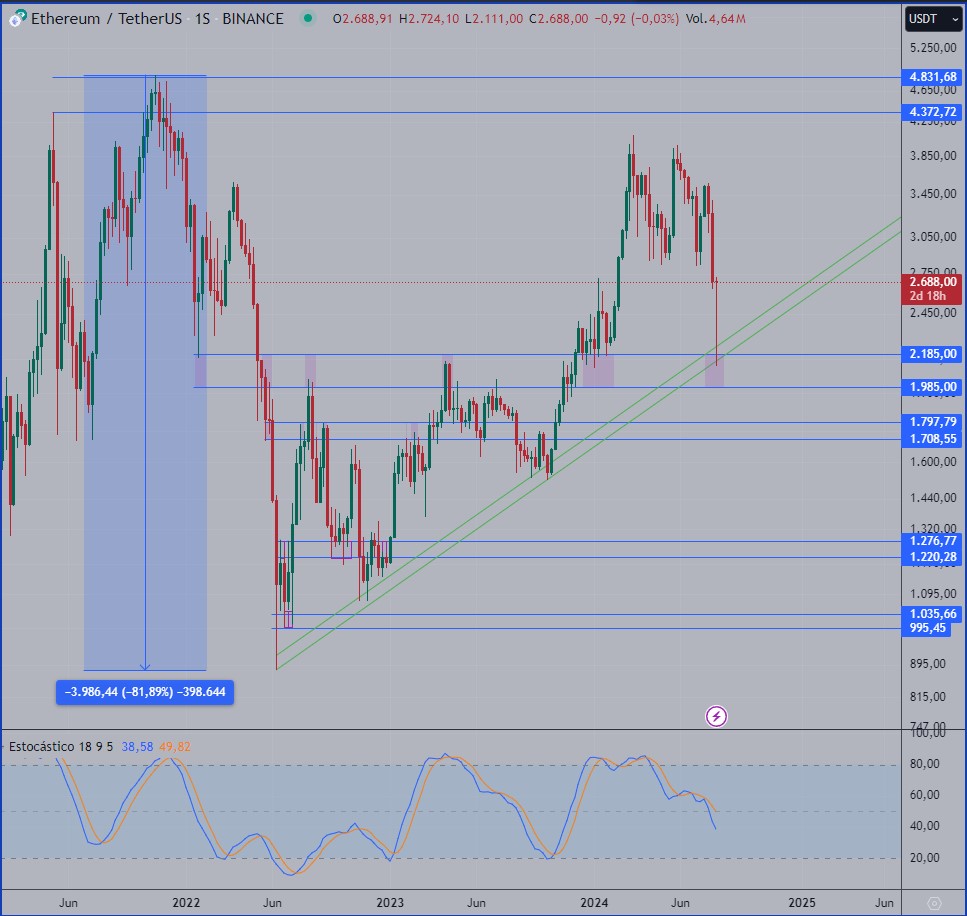
Ethereum Tradingview Weekly Graph
At the end of 2022, Ethereum reached an all-time high of 4,868 USDT, reflecting a culmination of bullish sentiment fueled by market optimism, increased adoption, and the broader cryptocurrency market rally. However, this peak was followed by an 82% correction, bringing Ethereum back down to more sustainable levels.
Despite this significant pullback, Ethereum has shown resilience. The price correction was followed by a sequence of higher lows and flat highs, indicating a possible stabilization phase. This trend continued into December 2023, when Ethereum broke through a critical resistance zone between 1985 and 2185 USDT. This breakout suggested a renewed interest in ETH, potentially setting the stage for future gains.
The Impact of Ethereum ETFs
One of the most significant developments in the Ethereum landscape has been the introduction of Ethereum ETFs. These financial products have provided traditional investors with easier access to Ethereum, potentially broadening its investor base. Ethereum ETFs allow investors to gain exposure to ETH without directly purchasing the cryptocurrency, thus mitigating some of the complexities associated with holding and securing digital assets.
The launch of these ETFs has had a dual effect on Ethereum’s market behavior:
- Increased Liquidity and Market Stability: ETFs typically attract institutional investors, who tend to hold assets for longer periods, contributing to market stability. This influx of institutional money can also lead to increased liquidity, making it easier for large trades to occur without causing significant price volatility.
- Enhanced Price Discovery: With more participants in the market, especially from the institutional side, price discovery for Ethereum becomes more efficient. This has likely contributed to the breaking of the resistance zone mentioned earlier, as more sophisticated investors engage in the market.
Price Evolution and Technical Analysis
After Ethereum’s breakout from the 1985-2185 USDT resistance zone, the price continued to rise for six months. This upward movement was encouraging, but it eventually led to a period of lateral consolidation, forming a double top pattern. A double top is often seen as a bearish reversal pattern, and in this case, it did result in a downward projection.
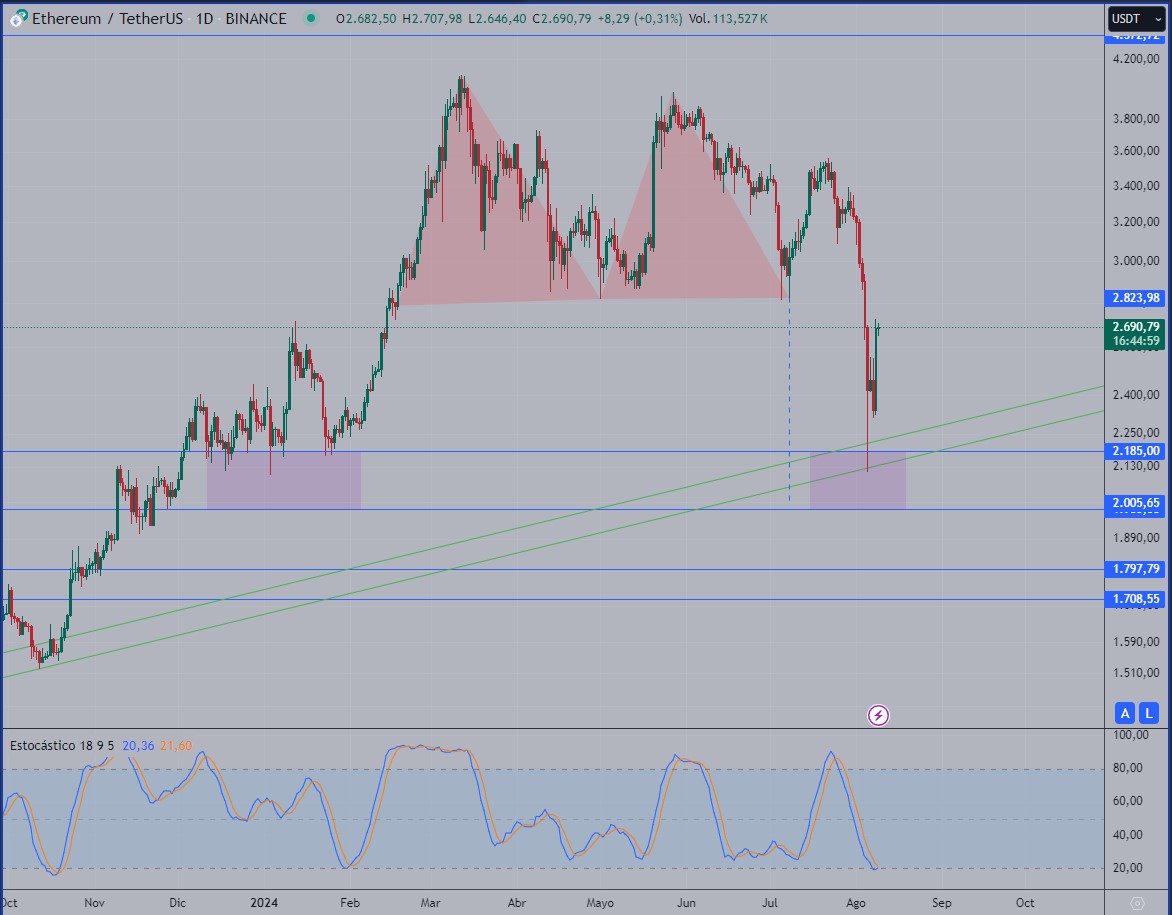
Ethereum Tradingview Daily Graph
The downward movement brought Ethereum’s price to a significant confluence zone, characterized by:
- The Trendline Framing the Upward Trend: This trendline has been a key support level for Ethereum throughout its recovery from the 82% correction.
- A Major Support Zone: The price of Ethereum reached a critical support zone, which had previously acted as a floor during earlier corrections.
- The 61.8% Fibonacci Correction: This Fibonacci level is often seen as a strong indicator of potential reversal points, and its confluence with the trendline and support zone added to its significance.
At this confluence zone, Ethereum experienced a rebound.
The weekly stochastic oscillator, which had previously been in overbought territory, cleared these signals, indicating that the market was no longer overextended. Meanwhile, the daily stochastic oscillator entered the oversold zone, with a crossover of the lines suggesting a potential reversal to the upside.
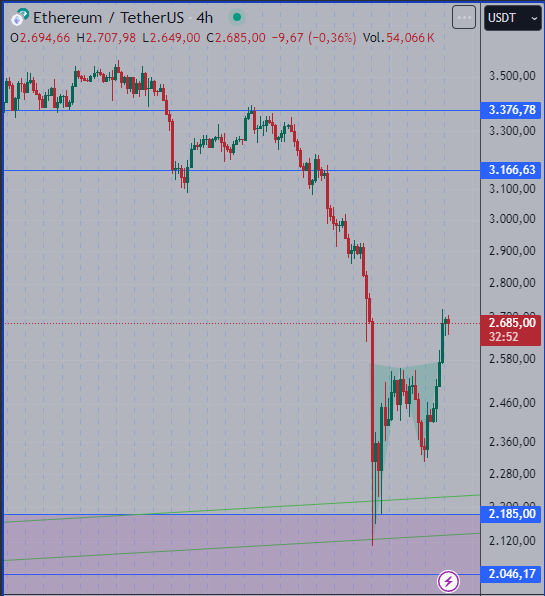
In the very short term:
The rebound has generated a potential double bottom that could initiate a more significant consolidation at these levels and, from there, start a new upward movement.
Potential Scenarios Moving Forward
Given the current technical setup and broader market conditions, there are two primary scenarios to consider for Ethereum’s price action in the near term:
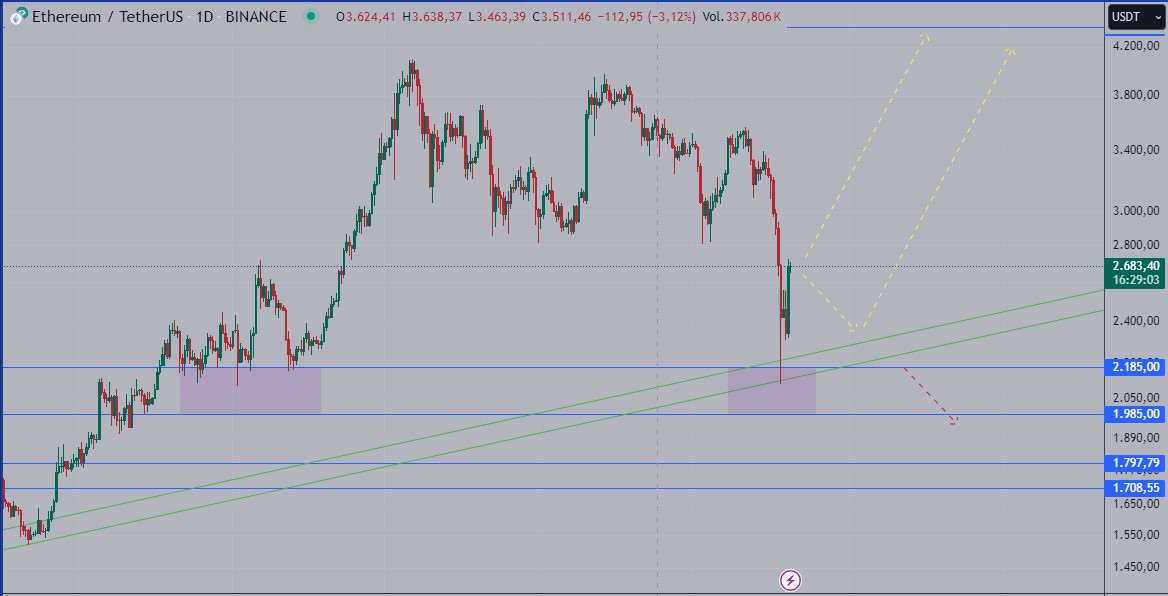
Scenario 1: The Yellow Path – A Major Rebound
In the first scenario, a significant rebound is expected due to the importance of the current support zone. This rebound could happen immediately or after a more prolonged consolidation phase. The confluence of the trendline, support zone, and Fibonacci level creates a strong foundation for a potential upward movement.
Investors who believe in this scenario might consider this an opportune time to make strategic purchases of Ethereum, anticipating that the market will resume its upward trajectory. The introduction of ETFs may also play a role in this scenario by providing additional buying pressure from institutional investors looking to capitalize on this potential bounce.
Scenario 2: The Red Path – A Deeper Correction
The second scenario, while less likely due to the strength of the current support zone, involves a deeper correction. This scenario could unfold in the context of extreme geopolitical events or significant macroeconomic shifts that negatively impact the broader financial markets.
In this case, Ethereum could break through the current support levels and retest lower support zones. However, given the current market structure and the presence of ETFs adding stability to the market, this scenario is seen as less probable.
The Role of Geopolitical and Macroeconomic Factors
While the technical analysis provides a roadmap for potential price movements, it’s crucial to consider the broader geopolitical and macroeconomic context. Cryptocurrency markets, including Ethereum, are highly sensitive to global events. For instance, economic sanctions, regulatory changes, or significant shifts in monetary policy could all impact investor sentiment and market dynamics.
Moreover, the introduction of Ethereum ETFs adds another layer of complexity, as these instruments are also influenced by broader financial market trends. For example, if traditional equity markets were to experience significant volatility, this could spill over into cryptocurrency ETFs, potentially exacerbating price movements in Ethereum.
Conclusion
Ethereum’s recent market behavior, influenced by both technical factors and the introduction of ETFs, presents a compelling case for investors. The confluence of the upward trendline, major support zone, and the 61.8% Fibonacci correction suggests that Ethereum is at a critical juncture.
While a significant rebound (Yellow Path) appears to be the more likely scenario, it is essential for investors to remain vigilant and consider the potential for a deeper correction (Red Path), particularly in the face of unforeseen geopolitical or macroeconomic events.
As always, the cryptocurrency market remains highly volatile and unpredictable. Investors should approach Ethereum with a well-considered strategy, taking into account both the technical indicators and the broader market context. The presence of Ethereum ETFs, while providing additional stability, also introduces new dynamics that could influence Ethereum’s future price movements. Whether the rebound materializes or a deeper correction unfolds, Ethereum will likely remain a key player in the evolving landscape of digital assets.
As always, this article does not constitute financial advice and you should be sure to do your own research and consult a professional financial advisor before making any investment decision.
To stay up to date on all things crypto, like Xcoins on Facebook, and follow us on Twitter, Instagram, and LinkedIn.