


Winds of Change: A Deep Dive into the Current Market Trends for Bitcoin and Ethereum
As we approach the final quarter of 2024, the cryptocurrency market seems to be at a critical juncture. After experiencing a strong bullish rally that came to a close at the end of Q1 2024, two of the most significant digital assets in the market, Bitcoin and Ethereum are exhibiting unique price behaviors that could signal upcoming shifts in the broader market sentiment.
Bitcoin’s Consolidation Phase and the Expanding Wedge Formation
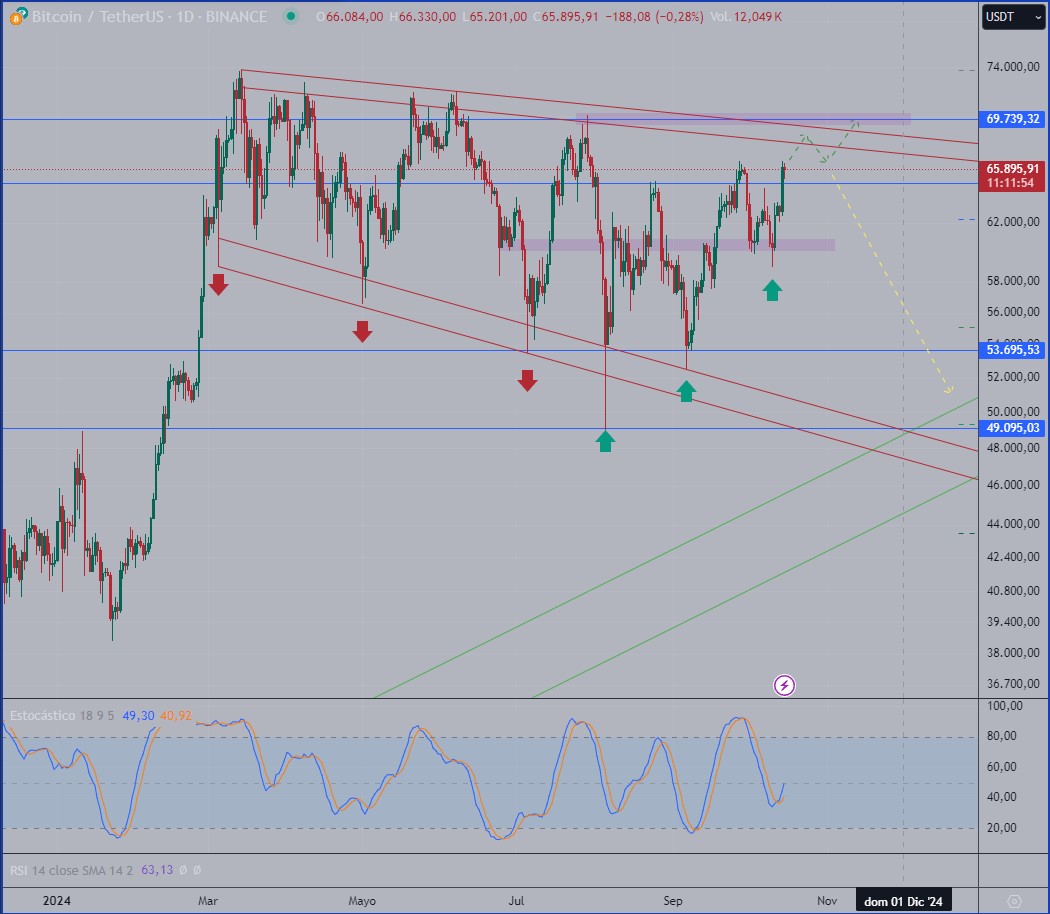
Bitcoin, after reaching new highs earlier this year, has entered a consolidation phase. This phase is characterized by an expanding wedge pattern, which often signifies an impending breakout or a breakdown, depending on how the price behaves near key levels.
In early August, Bitcoin reached the crucial pivot zone around $50,000. Since then, the price action has shown a consistent upward trend, with both higher highs and higher lows. This development has excited both technical analysts and long-term holders alike, as the market seems to be inching towards a significant price action near the $70,000 mark.
At present, Bitcoin is approaching the confluence of the upper band of the expanding wedge and its previous high around $70,000. Two distinct scenarios could unfold from this point, each with profound implications for the market.
Scenario A: A Bullish Breakout
The first and most optimistic scenario is that Bitcoin reaches the upper band of the expanding wedge, makes a brief pullback, and subsequently breaks to the upside. If this happens, and Bitcoin closes above $70,000 on a sustained basis, it would likely signal the end of the consolidation phase. Such a breakout would indicate a renewed bullish trend, presenting a significant buying opportunity for those looking to enter or expand their positions in Bitcoin.
Traders and investors alike are eyeing this possibility closely, as breaking past the $70,000 resistance would bring Bitcoin closer to uncharted territory. With the psychological barrier of $100,000 looming on the horizon, a confirmed breakout could ignite another wave of enthusiasm in the market, possibly driving even more institutional interest and retail participation.
Scenario B: A Downward Correction
On the other hand, the second scenario suggests that Bitcoin could fail to break above the upper band of the expanding wedge, leading to a downward correction. In this case, Bitcoin may enter a new leg downwards, potentially revisiting the $50,000 pivot zone that acted as a key support level earlier in the year.
While a drop to $50,000 might initially be seen as bearish, this level could offer an attractive buying opportunity for long-term investors who subscribe to the Dollar-Cost Averaging (DCA) strategy. DCA involves purchasing a fixed amount of Bitcoin at regular intervals, regardless of price, which helps mitigate the impact of volatility over time. A drop to this level could encourage investors to accumulate more Bitcoin at a discount, with the expectation that the long-term trend remains bullish.
Both of these scenarios are contingent upon how Bitcoin behaves in the coming weeks. Investors should keep a close eye on the price action as it nears the $70,000 resistance level and be prepared for potential volatility.
Ethereum: A Different but Equally Promising Setup
While Bitcoin’s price action is centered around the expanding wedge and consolidation, Ethereum presents a slightly different chart pattern that suggests it could also be poised for a significant move.
Ethereum, like Bitcoin, has experienced a robust recovery in 2024, but its price action has been characterized by a sequence of lower highs and higher lows—a pattern that often precedes a breakout, either to the upside or the downside.
One of the key technical aspects of Ethereum’s chart is its repeated interactions with an upward trendline. After bouncing off this trendline three times, Ethereum appears to be gearing up for another potential upward move. This trendline has provided strong support for the asset, and its ability to hold above this level will be crucial for its short-term price direction.
Key Levels to Watch for Ethereum
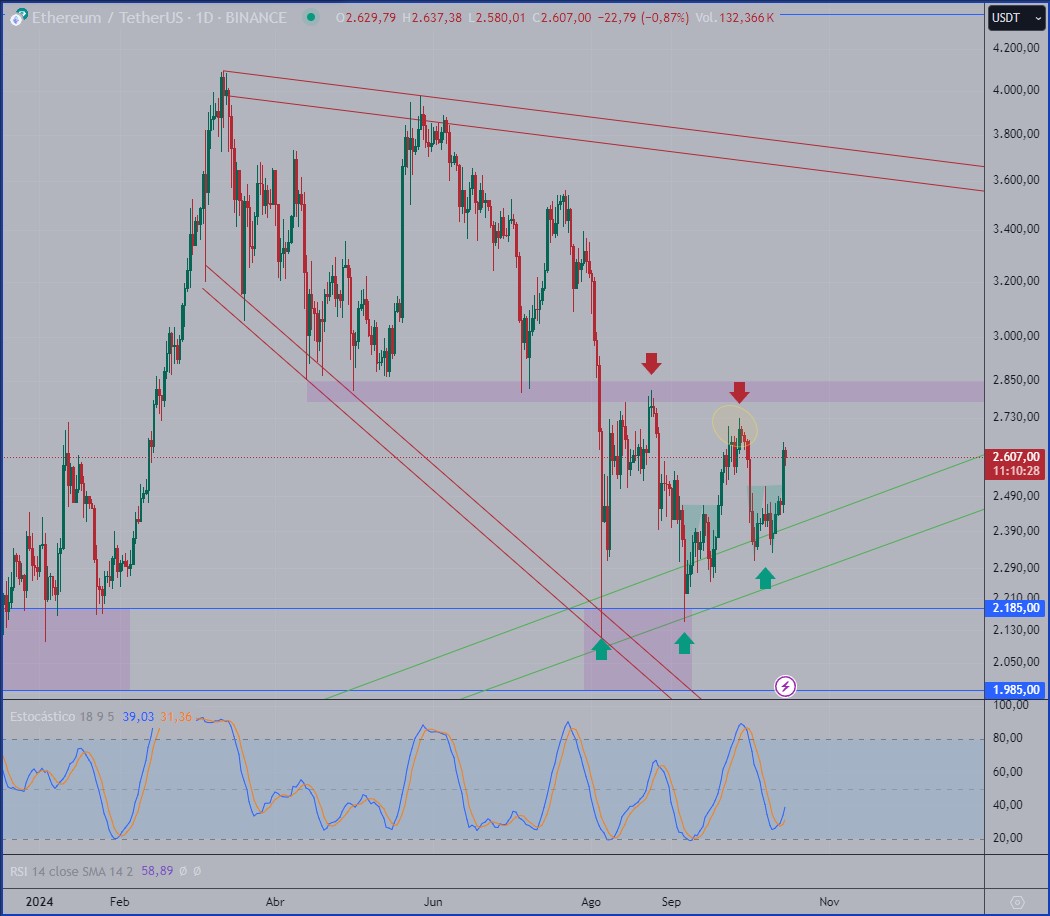
As Ethereum consolidates, two key levels are particularly important: the last significant short-term high around $2,730 and the pivot zone located near $2,800. These levels represent important resistance points, and a successful break above them could pave the way for further gains.
If Ethereum manages to clear the $2,800 pivot zone, it would open the door for a potential rally towards the upper band of its expanding wedge formation. This move would represent a significant upside for the asset, and many traders are looking at this level as a potential trigger for a bullish continuation.
Additionally, Ethereum has benefitted from a series of favorable technical setups over the past few months. Each time the price has interacted with the upward trendline, it has presented a buying opportunity. The current situation appears to be no different, with many analysts predicting that Ethereum could see further gains in the short to medium term.
However, just as with Bitcoin, Ethereum’s future price action will depend on how the market reacts to key resistance levels. Should Ethereum fail to break above $2,800, it could experience a period of consolidation or a pullback towards the lower end of its current range.
What These Trends Mean for Investors
Both Bitcoin and Ethereum are at critical junctures in their respective price cycles. For Bitcoin, the question is whether the consolidation phase will end with a bullish breakout or if the price will revisit key support levels around $50,000. For Ethereum, the challenge lies in breaking through the $2,800 pivot zone to unlock further upside potential.
In both cases, the expanding wedge formations in play suggest that volatility is likely to increase in the coming weeks. For investors, this means that there are potential opportunities on both the long and short sides of the market, depending on how the price action develops.
For long-term investors, these potential pullbacks may represent buying opportunities, especially for those using strategies like Dollar-Cost Averaging. The broader trend for both Bitcoin and Ethereum remains positive, and any significant dips could provide opportunities to accumulate more at attractive prices.
On the other hand, for short-term traders, the key will be to monitor the price action closely around the resistance levels mentioned above. A break above these levels could signal the start of a new bullish phase, while a failure to do so could result in a short-term pullback or consolidation.
Conclusion: Winds of Change in the Crypto Markets
The winds of change appear to be blowing in the cryptocurrency markets, with both Bitcoin and Ethereum on the verge of significant price movements. While the direction of these moves remains uncertain, the technical setups for both assets suggest that the coming weeks could be pivotal for the market.
Whether you are a long-term investor or a short-term trader, it is essential to stay informed and be prepared for any potential volatility. As always, prudent risk management and a clear understanding of your investment goals will be key to navigating the ever-evolving crypto landscape.
Now is an ideal time to consider adding Bitcoin and Ethereum to your portfolio. With both assets nearing key technical levels, the potential for a bullish breakout could lead to significant gains.
Don’t miss out on the opportunity to capitalize on these market conditions—might be time to start accumulating BTC and ETH today!