Analyzing Bitcoin Trends: Insights for Investors July 2024
Quick Takeaways
- 2017 to 2020 Trends: Established foundational price movements; significant corrections in 2020 and 2023 marked key support zones.
- Accelerated Trendline (2023-2024): Breached in June 2024, leading to a retracement and rebound.
- Scenario A: Breaking above previous highs indicates a strong buying opportunity with a potential substantial rise.
- Scenario B: Sideways movement may lead to time consolidation; investors can accumulate positions or range trade.
- Scenario C: Breaking the trendline could lead to a drop to 30K, with cautious buying opportunities if 25K support holds.
- Strategic Monitoring: Watch critical levels for market direction, understanding that investing is based on probabilities, not certainties.
When diving into the historical and current trends of Bitcoin, we can identify several significant patterns that provide insight into potential future movements. Let’s dive in
Historical Bitcoin Trends From 2017 to July 2024
1. Initial Trend: 2017 to Q2 2020
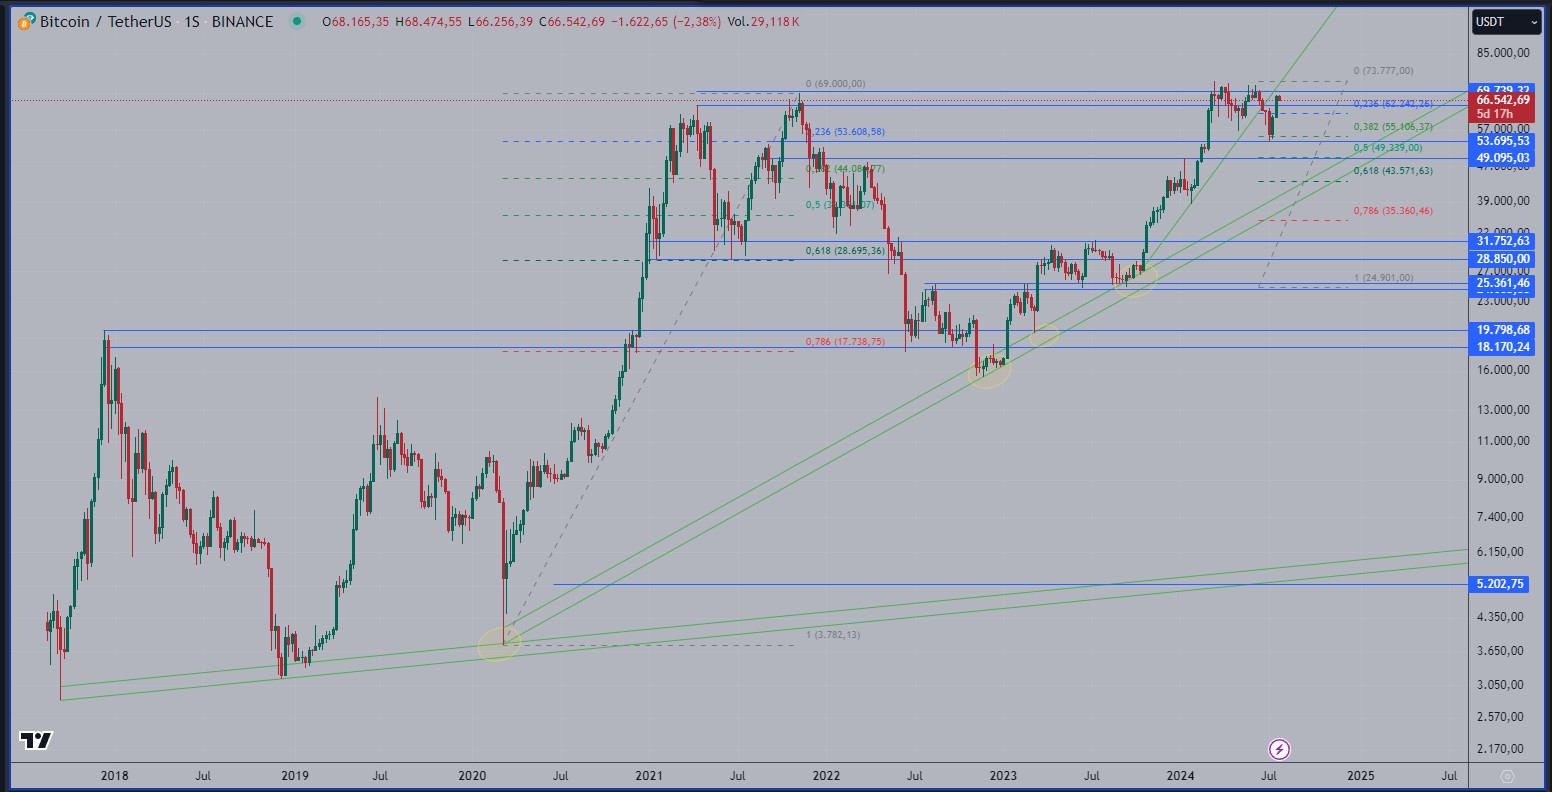
Bitcoin’s first major trend, observed between 2017 and Q2 2020, highlights three key touchpoints that mark significant price movements during this period. These points form the foundation for understanding subsequent trends and corrections.
2. Trends from 2020 and 2023 Lows
- Significant Correction: The notable low points in 2020 and 2023 represent a substantial correction following the substantial rise between March 9, 2020, and November 8, 2021.
- Multiple Touches: This trend zone has been revisited up to four times, as indicated by the yellow ellipses on the chart, underscoring its significance in Bitcoin’s price history.
3. Accelerated Trendline: October 16, 2023, to June 17, 2024
- Trendline Break: An accelerated trendline, starting from October 16, 2023, was breached on June 17, 2024, leading to a decline that completed a 38.2% Fibonacci retracement.
- Support and Rebound: Post-break, Bitcoin found support in a critical zone and has since initiated a rebound, signaling a potential new trend formation.
Scenarios for Investors in July 2024
Scenario A: Break Above Previous Highs
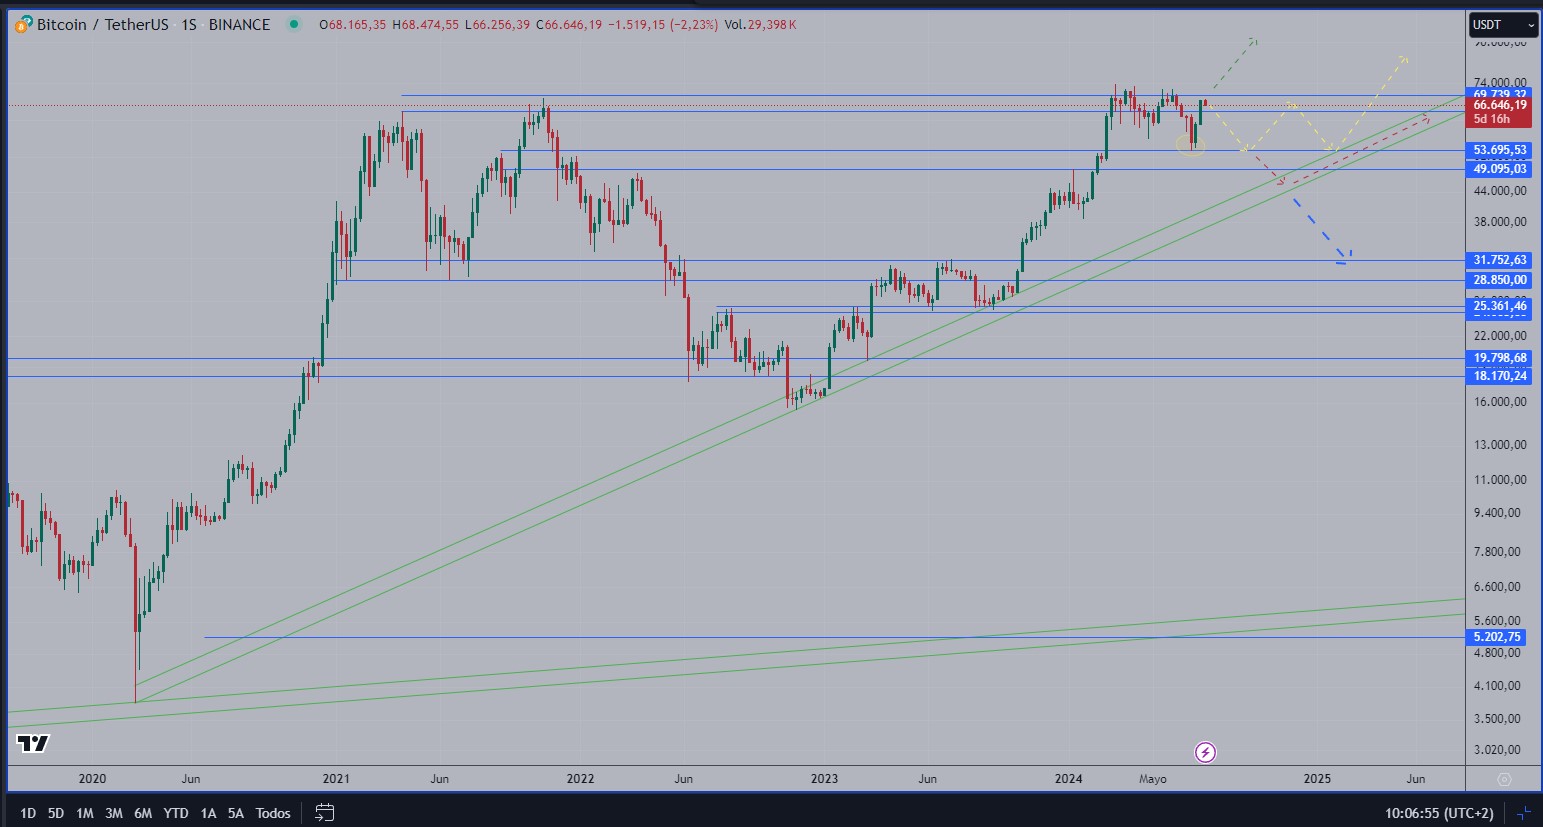
- ABC Correction: If Bitcoin’s price breaks above the previous highs, this movement will confirm an ABC correction. Technical analysis suggests this could lead to a “free rise,” presenting a strong buying opportunity.
- Recommendation: Investors should consider buying, aligning with the green arrow scenario, where the potential for profit is high.
Scenario B: Sideways Movement and Time Consolidation
- Consolidation Path: Should the price move sideways, a time consolidation phase will occur. This could lead to either an upward breakout (Scenario A) or a downward price consolidation.
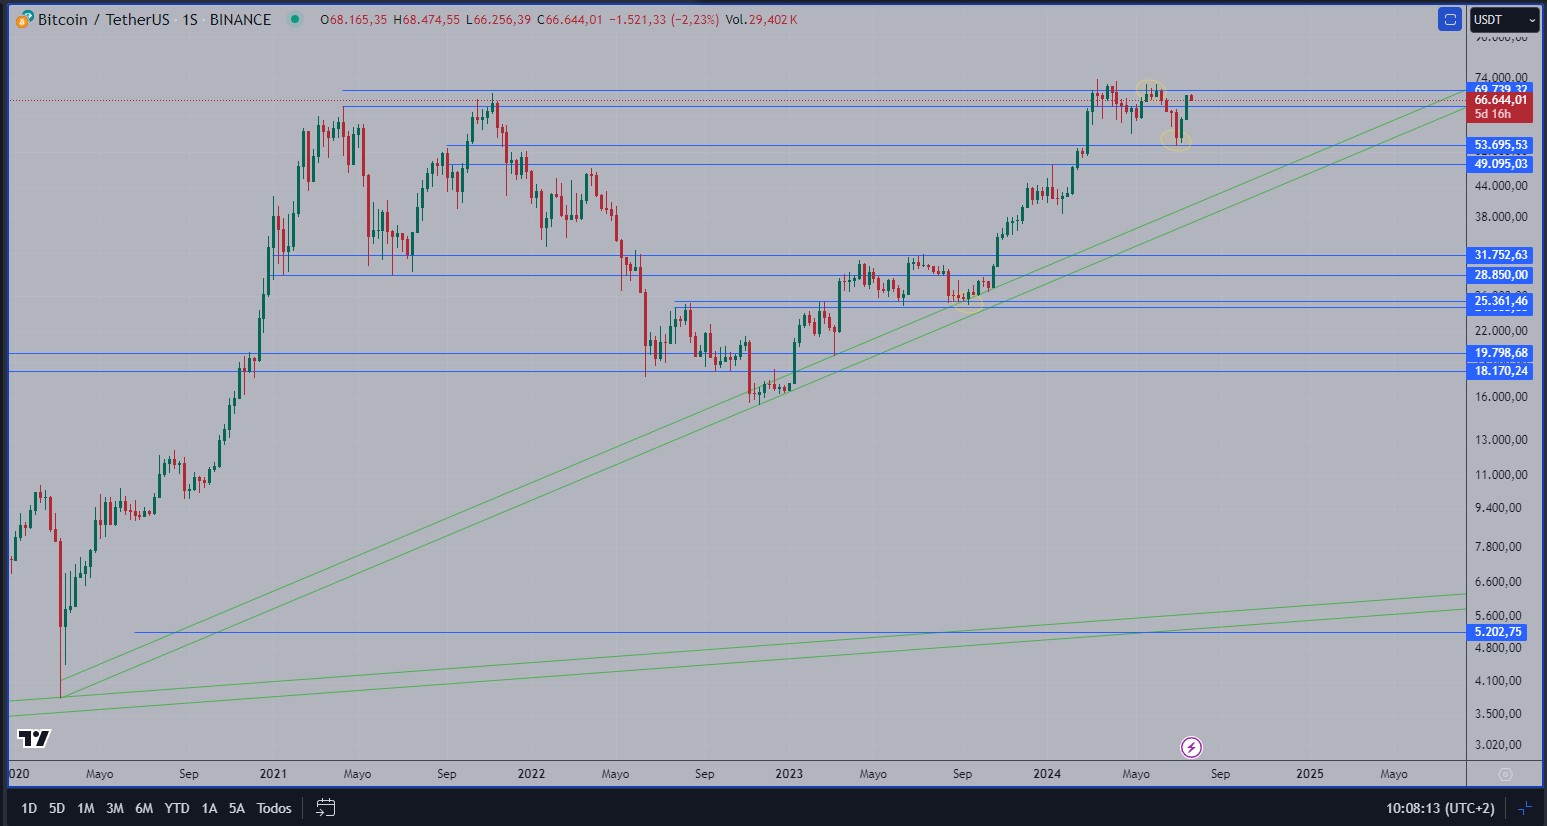
- Key Levels: Breaking below the July 1st low (highlighted by the yellow ellipse) could trigger a deeper consolidation, pushing the price toward the upward trendline.
- Strategy: Investors might accumulate positions during consolidation phases or engage in range trading, anticipating a breakout.
Scenario C: Break of the Trendline
- Downward Risk: If Bitcoin breaks the trendline initiated in 2020, the price could fall to around the 30K mark, a zone combining a strong support level and the 61.8% Fibonacci retracement.
- Buying Opportunity: This area could be an excellent buying opportunity, provided the significant low around 25K is respected. However, investors should be cautious as this represents a danger area.
Caution: Following the blue arrow scenario, investors should prepare for potential market volatility and plan their entries and exits accordingly.
Conclusion
As we move through July 2024, Bitcoin’s trend appears to have paused, awaiting a decisive move. Investors should closely monitor the critical levels marked by the yellow ellipses to determine which scenario will materialize. It is crucial to remember that investing is about probabilities, not certainties. Breakouts of resistance zones, Fibonacci levels, or trendlines in an uptrend indicate potential buying areas with high profit probabilities, but no strategy is infallible.
Good luck with your investments!
As always, this article does not constitute financial advice and you should be sure to do your own research and consult a professional financial advisor before making any investment decision.
To stay up to date on all things crypto, like Xcoins on Facebook, and follow us on Twitter, Instagram, and LinkedIn.


