Ethereum Technical Analysis November 2024: A Crucial Moment for ETH
Ethereum (ETH), the second-largest cryptocurrency by market capitalization, finds itself at a pivotal point as 2023 concludes. Much like Bitcoin, Ethereum experienced a remarkable bullish momentum in the final quarter of the year, which has since transitioned into a phase of consolidation characterized by an expanding wedge pattern. In this article, we’ll delve into the recent price action, key technical levels, and possible scenarios for Ethereum’s trajectory in the near future.
The Bullish Surge and Pivot Zone
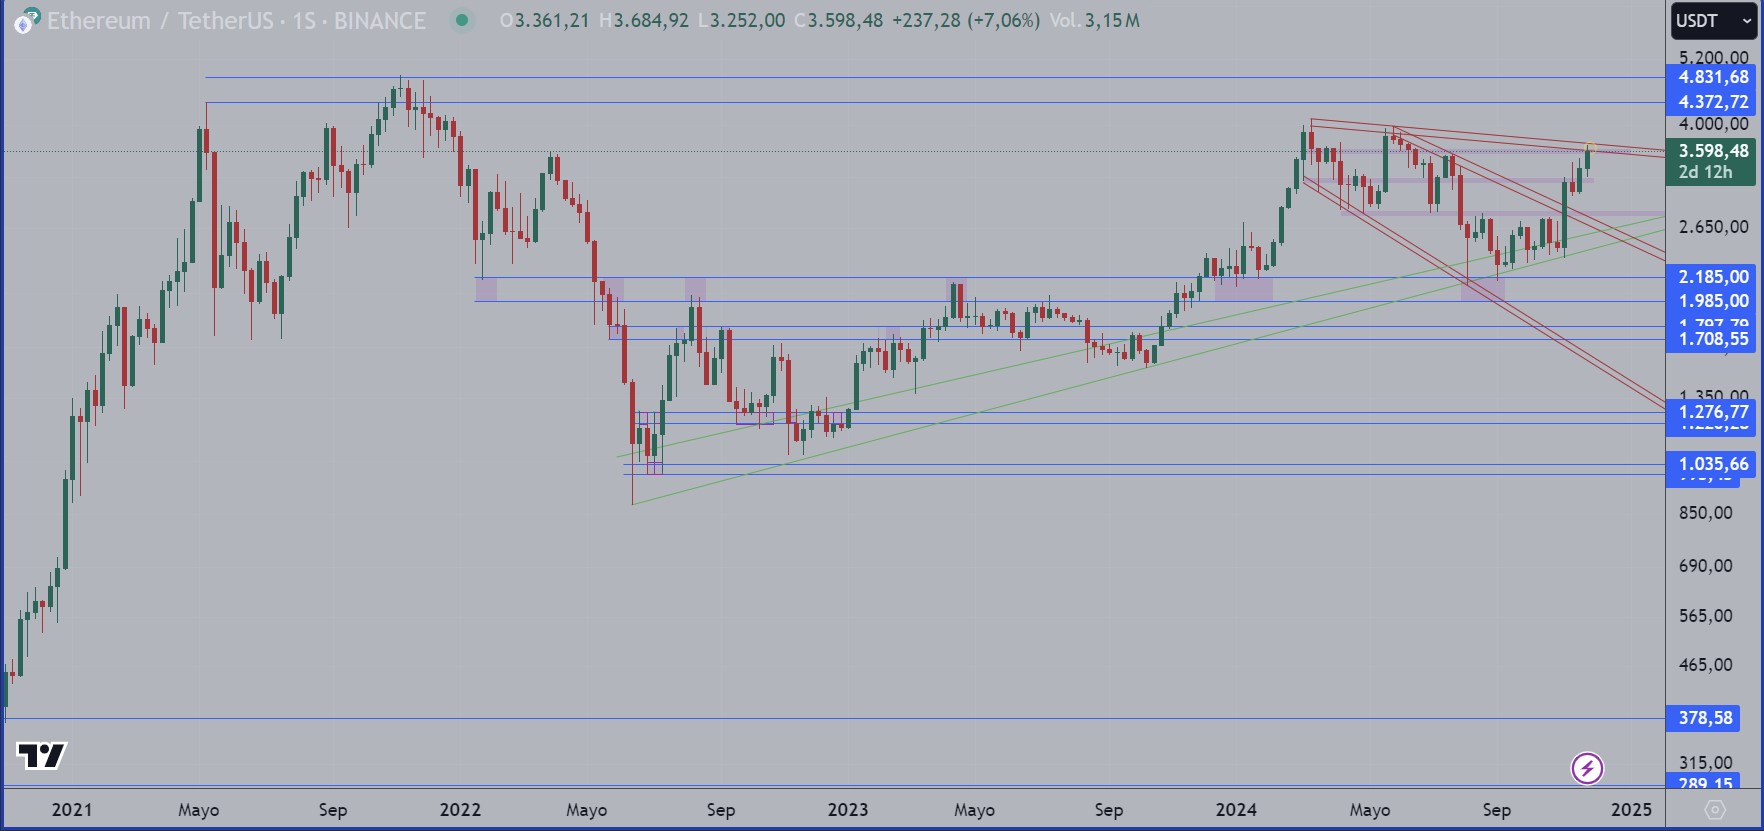
Source: TradingView, Weekly Chart
Ethereum’s price action in late 2023 was marked by a strong uptrend, propelling its value higher. However, this surge was followed by a significant correction, bringing ETH back to test the critical pivot zone around $2,000. This area served as a foundation for the cryptocurrency to regain bullish momentum.
Two key factors influenced this renewed uptrend:
- U.S. Elections: Political and economic events often impact the cryptocurrency market, and the 2023 elections in the United States played a role in boosting investor sentiment.
- Bitcoin’s Rally: Bitcoin’s own strong performance served as a catalyst, driving broader market confidence and encouraging capital flows into Ethereum.
In recent weeks, ETH’s uptrend has gained acceleration, bringing it to a critical resistance zone where several technical factors converge.
Critical Resistance: A Confluence Zone
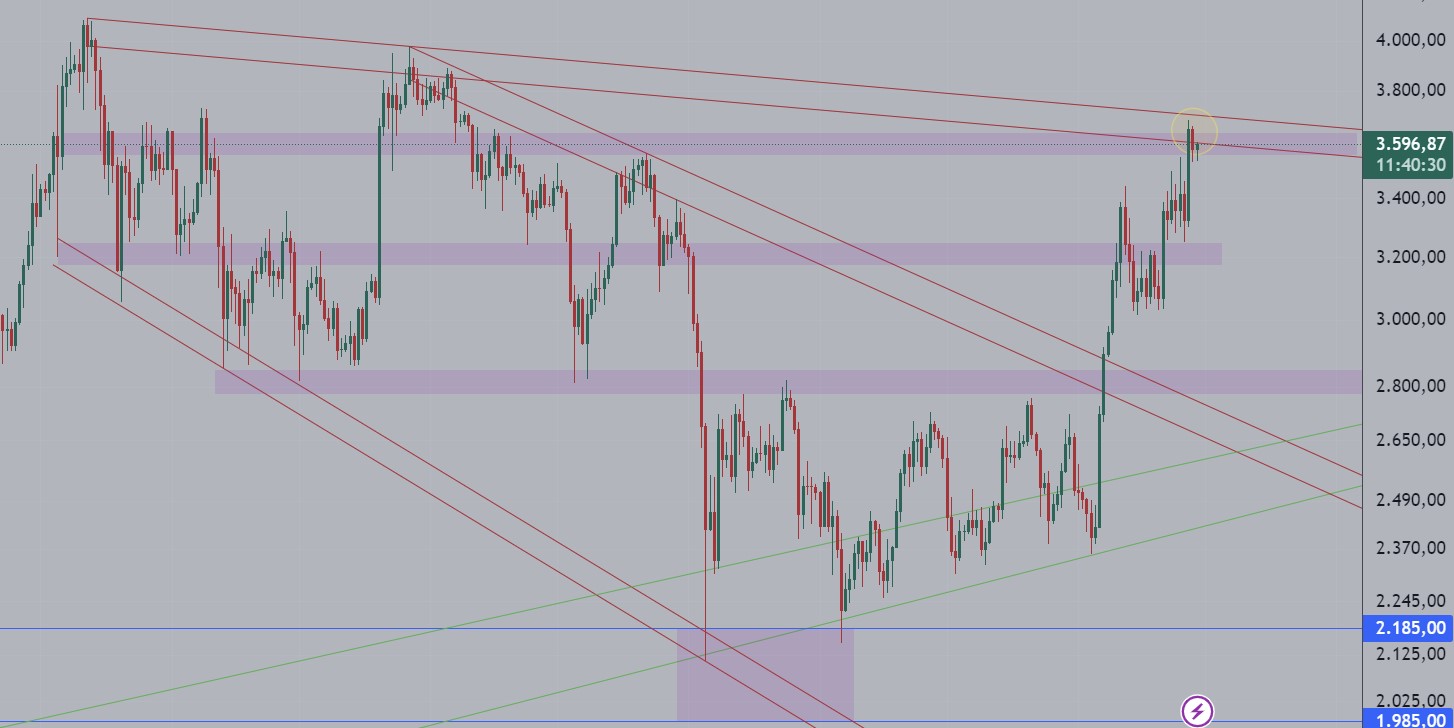
Currently, Ethereum is at a decisive juncture. The price is testing a confluence zone consisting of:
- Descending Trendline: This trendline connects the recent major highs, forming a important resistance.
- Medium-Term Resistance Level: Overlapping with the trendline, this horizontal level has historically acted as a barrier to further upward movement.
These intersecting levels represent significant technical resistance, making Ethereum’s next move crucial for traders and investors alike.
The Daily Chart: Key Observations
Source: Trading View, Daily Chart
Analyzing Ethereum’s daily chart reveals the expanding wedge consolidation phase. This pattern often indicates indecision in the market, with price action oscillating within a widening range. Traders are now watching closely for signs of a breakout or rejection.
What’s Next for Ethereum?
From a technical standpoint, Ethereum faces two equally probable scenarios:
Scenario A: Bullish Breakout
In this scenario, ETH would break above the descending trendline and medium-term resistance. A breakout is often accompanied by increased trading volume, signaling strong market participation. Key elements to monitor in this case:
- Retest of the Breakout: Following a breakout, prices often return to test the breached resistance level, now acting as support. This retest provides an opportunity for traders to confirm the breakout’s validity.
- Buying Opportunity: A successful retest can offer an excellent entry point for buyers, anticipating further upside potential.
Scenario B: Rejection and Consolidation
If Ethereum fails to breach the resistance zone, a rejection could lead to:
- Downward Correction: The price might retrace to test lower support levels or consolidate laterally within the expanding wedge.
- Extreme Downside Risk: In an unlikely extreme case, ETH could reverse entirely, revisiting the major ascending trendline depicted in green on the charts. This scenario would suggest a more bearish outlook.
Indicators to Watch
Several technical indicators can provide additional insights into Ethereum’s direction:
- Relative Strength Index (RSI): Overbought or oversold conditions could hint at potential reversals.
- Volume Analysis: High volume during a breakout strengthens the case for a sustained move.
- Moving Averages: Watching key moving averages (e.g., 50-day, 200-day) for crossover signals or support/resistance alignment.
Conclusion: A Time to Watch Closely
Ethereum’s current position demands close monitoring. The confluence of the descending trendline and medium-term resistance creates a high-stakes scenario, with implications for both short-term traders and long-term investors. A breakout could offer a compelling buying opportunity, while a rejection may necessitate caution.
For those looking to act on Ethereum’s potential, Xcoins is your go-to platform for a seamless and secure way to buy ETH, ensuring you don’t miss out on the next big move.
As we move into 2025, Ethereum’s price prediction is set to be yet another cornerstone of the cryptocurrency market. Its performance will not only influence its own valuation but also reflect broader market trends. Stay tuned to key technical levels and market developments to navigate this critical phase effectively.
The information provided in this analysis is for informational and educational purposes only. Technical analysis relies on historical data and probabilities and does not guarantee future performance. Always conduct thorough research and consult a financial advisor before making investment decisions.
To stay up to date on all things crypto, like Xcoins on Facebook, and follow us on Twitter, Instagram, and LinkedIn.


