


Ethereum Price Analysis: Calm Before the Storm?
After experiencing a sharp price correction during the first week of August, Ethereum’s price appears to have stabilized, entering what can be described as a lateral consolidation phase. This period of relative calm has prompted market participants to speculate about the next major move. In this article, we will explore the current technical outlook for Ethereum, evaluate key levels to watch, and assess whether the market is indeed in a “calm before the storm” phase.
Ethereum: Price Stabilization and Lateral Movement
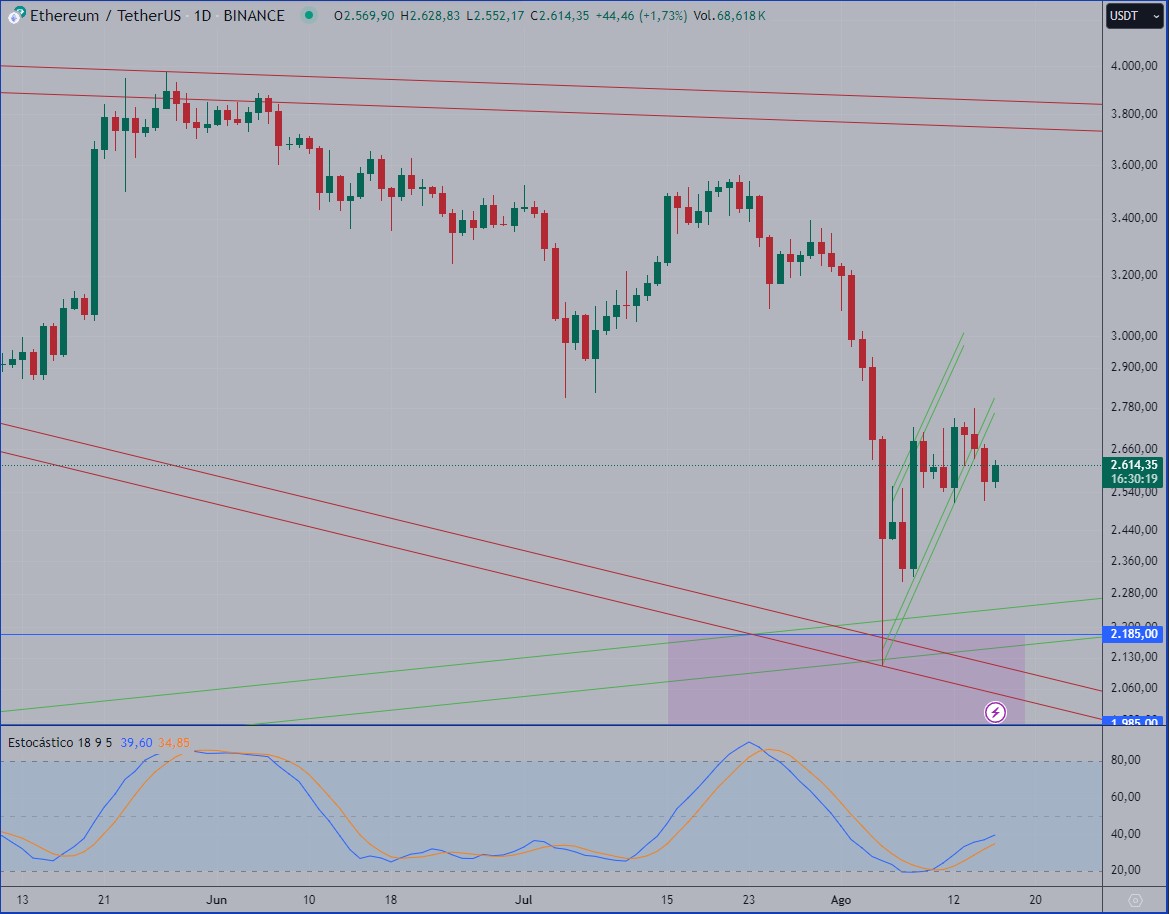
Source: Trading View Ethereum 16th August 2024 1 Day
Ethereum’s recent correction took many by surprise, but the subsequent stabilization offers some hope that the worst may be over, at least for now. Following the initial rebound, Ethereum’s price has shifted into a lateral phase, marked by flat lows and slightly higher highs. This sideways movement indicates that the market is in a state of indecision, with neither bulls nor bears managing to gain a decisive upper hand.
Zooming in on the price action, we can see that Ethereum recently broke below an ascending trendline that had provided support throughout the earlier stages of its recovery. However, the breakdown was not followed by aggressive selling, suggesting that the market remains relatively calm.
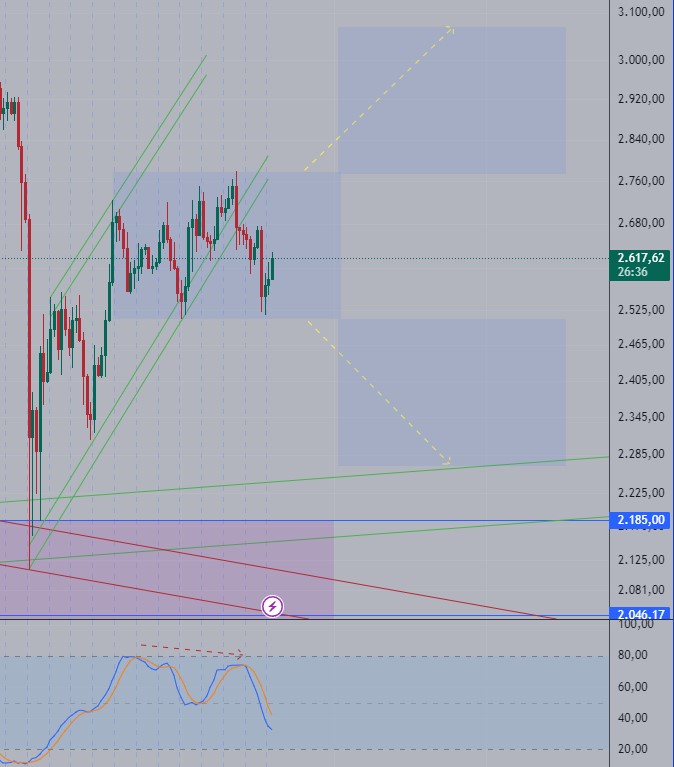
Source: Trading View Ethereum 16th August 2024 4 Hours
At this stage, the price appears to be consolidating, and traders are closely watching for a breakout in either direction. Given the current technical setup, a break above or below the consolidation zone could signal the next major move in the market.
Key Levels to Watch
- Support Zone and the Major Ascending Trendline
If Ethereum fails to hold its current lateral consolidation and breaks below the lower boundary of the consolidation zone, the price could revisit the major ascending trendline. This trendline has historically served as a reliable support level, and traders could expect another rebound if the price reaches this area. A bounce from this trendline would likely reinvigorate bullish sentiment and could provide a launching pad for a renewed uptrend. - Zone Between $3,000 and $3,100
On the flip side, if Ethereum manages to break above the upper boundary of the consolidation zone, we could see a resumption of the short-term uptrend. Such a breakout would likely be accompanied by higher lows, a strong signal of bullish momentum. Should this scenario play out, the next target for the price would be the zone between $3,000 and $3,100.
Head-and-Shoulders Pattern: A Bearish Indicator?
Some market observers may foresee the potential formation of a head-and-shoulders pattern, a classic bearish reversal formation. This pattern typically signals that an uptrend is nearing its end, and a breakdown below the neckline could trigger a more significant decline. While it is too early to confirm the completion of this pattern, the potential for its development adds an element of caution to the current market outlook.
If a head-and-shoulders pattern does indeed form, a break below the neckline would likely lead to a deeper pullback, potentially testing the major ascending trendline mentioned earlier. However, it is important to remember that patterns are not always reliable, and traders should wait for confirmation before making any major trading decisions.
Stochastic Indicator: Small Bearish Divergence
One of the key indicators to watch in the current market environment is the stochastic oscillator, which is a popular momentum indicator. In recent sessions, a small bearish divergence has been observed in the stochastic, with the indicator showing lower highs while the price has made slightly higher highs. This divergence suggests that bullish momentum may be weakening, although the indicator is currently at neutral values.
Given that the stochastic is not in overbought territory, it is possible that this bearish divergence has already been processed by the market. This would suggest that there is still room for a continuation of the uptrend, provided that the price breaks above the consolidation zone.
Is the Market Calm Before the Storm?
While the market appears calm at the moment, the technical signals suggest that we could be approaching a period of increased volatility. The lateral consolidation phase that Ethereum is currently in may be setting the stage for a significant move, and traders should be prepared for a potential breakout in either direction.
If Ethereum breaks below the lower boundary of the consolidation zone, the next stop could be the major ascending trendline, where we could see another attempt at a rebound. On the other hand, a break above the consolidation zone would likely signal a resumption of the short-term uptrend, with a potential target in the $3,000 to $3,100 range.
Conclusion
Ethereum’s current price action reflects a period of indecision, with the market in a lateral consolidation phase following a sharp correction earlier in August. Traders are closely watching for a breakout in either direction, with key levels of support and resistance providing potential targets for the next major move.
While there are signs of a possible head-and-shoulders pattern, it is too early to confirm its formation. Additionally, the small bearish divergence observed in the stochastic indicator suggests that bullish momentum may be waning, although the neutral reading of the indicator indicates that the market could still go either way.
In conclusion, while the market is calm for now, it is worth watching closely for any signs of an impending breakout. Whether the next move is up or down, it is likely to provide significant trading opportunities for those who are prepared.
As always, this article does not constitute financial advice and you should be sure to do your own research and consult a professional financial advisor before making any investment decision.
To stay up to date on all things crypto, like Xcoins on Facebook, and follow us on Twitter, Instagram, and LinkedIn.