


Cryptocurrency Market Analysis: BTC and ETH Outlook
In recent weeks Bitcoin (BTC) has experienced movements that align closely with previously anticipated scenarios. Technical indicators and price behavior suggest that the market is at a crucial juncture, providing potential opportunities for traders and investors. This article delves into the current situation of BTC and ETH, exploring key technical levels and offering insights based on recent price action.
Bitcoin (BTC) Analysis
 Source: Trading View
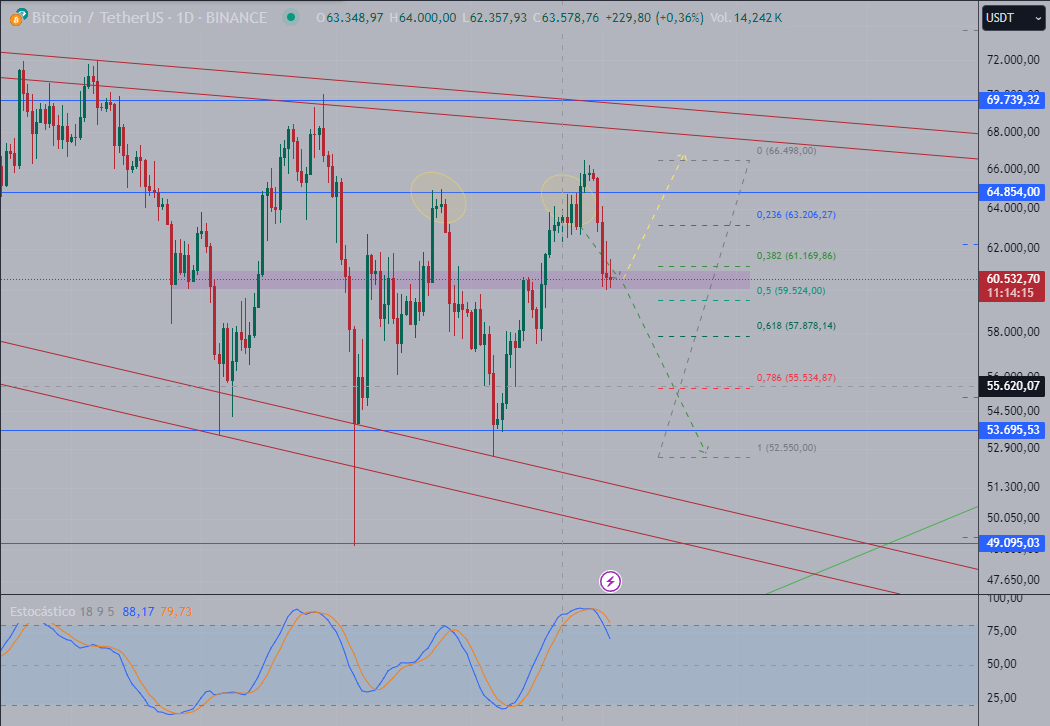
The price of Bitcoin is following the expected scenario with a remarkable degree of precision. It recently reached the levels of its last significant high, only to undergo a correction that has positioned it within the 38%/50% Fibonacci correction levels. This technical move indicates that the price action is currently within a consolidation phase—a point where market participants are weighing their next move.
Fibonacci Levels and the Congestion Zone
The Fibonacci retracement tool is often used to identify potential reversal levels, and in BTC’s case, the 38/50 levels are seen as key areas for buyers and sellers. At these levels, Bitcoin is encountering a congestion zone—a period of consolidation characterized by relatively low volatility and uncertain market direction.
From this congestion zone, two primary scenarios could unfold:
1. Upward Rebound: Bitcoin could initiate a new upward move from the current congestion zone. This would require a positive shift in market sentiment, supported by an increase in buying volume and bullish technical signals.
2. Descent Toward Lows: The alternative scenario is a move downward toward previous lows. This possibility is suggested by the Stochastic indicator, which is currently in overbought territory and has begun to turn downward. An overbought Stochastic typically signals that a correction or reversal may be imminent as buying momentum starts to wane.
BTC Technical Indicators and Their Implications
The Stochastic indicator’s overbought reading is a cause for concern, as it often suggests that a correction may follow. However, if Bitcoin can maintain support above its recent lows, it may provide a foundation for a renewed bullish trend. A break above the congestion zone with strong volume could confirm a new leg up, potentially targeting levels beyond the recent highs.
For now, traders should keep an eye on how BTC behaves around the 38/50 Fibonacci levels. A decisive break below could invalidate the bullish scenario, pushing Bitcoin into a bearish phase that would test lower support levels.
Ethereum (ETH) Analysis
Source: TradingView
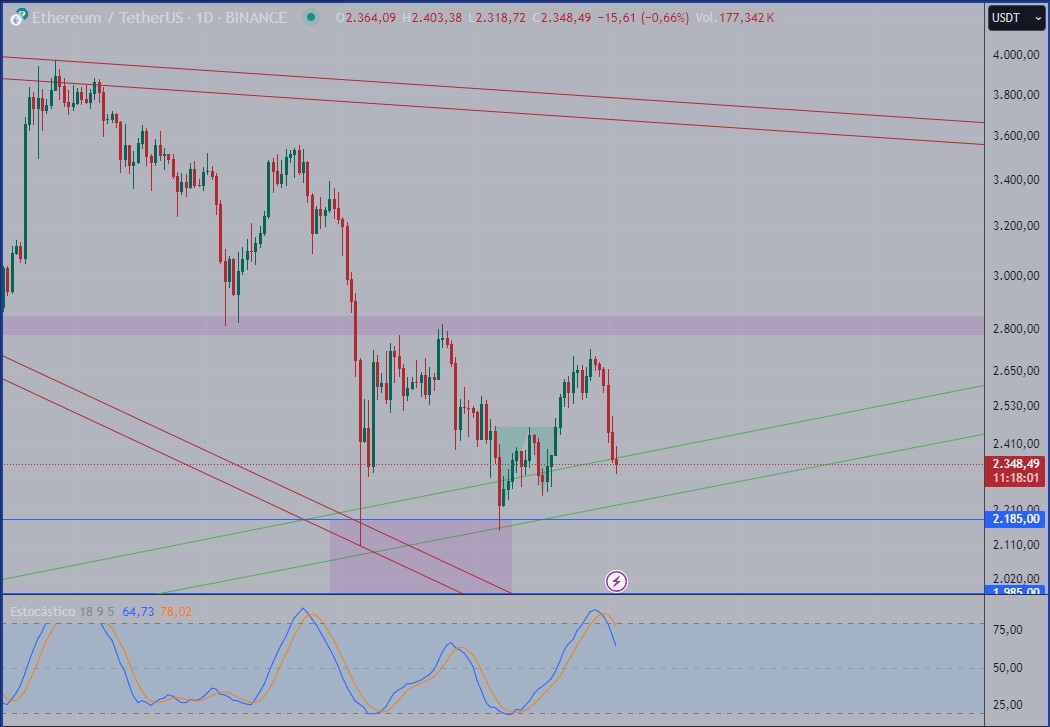
Ethereum has displayed a different but equally interesting pattern in recent trading sessions. The potential double bottom formation that was identified earlier has almost been nullified as the price has returned to the upward trendline. This movement indicates that the bullish structure has lost momentum.
Return to the Upward Trendline
The upward trendline has acted as a strong support level for ETH, suggesting that the market is not yet willing to abandon its bullish posture. This trendline could serve as a launchpad for further gains if it holds firmly against any downward pressure.
Pivot Zone Between 1985 and 2185
Ethereum is currently consolidating around a pivot zone between 1985 and 2185. This range represents a key support area that the price should not break to maintain the bullish outlook. A break below this zone could open the door for further declines, potentially targeting the next support levels at or below 1800.
Impact of Geopolitical Events on ETH
While the technicals are pointing towards a consolidation before a new bullish movement, it’s important to consider the influence of external factors. Geopolitical events, macroeconomic changes, and regulatory news can all have significant impacts on ETH’s price. As a result, traders and investors should remain cautious and adaptable to sudden shifts in market dynamics.
Favorable Buying Opportunities
Despite the potential risks, the current consolidation phase is a favorable zone for potential buying opportunities, provided the price does not break below the pivot zone. A sustained move above 2185 could signal renewed strength, setting up a move toward the next resistance level around 2500.
Conclusion: Navigating BTC and ETH’s Current Market Phase
Both BTC and ETH are at interesting technical levels, and how the market reacts in the coming days will be pivotal in determining their short-to-medium-term outlooks. For BTC, the 38%/50% Fibonacci levels serve as a key battleground between bulls and bears, while ETH’s ability to hold above its pivot zone will dictate whether it can maintain its bullish trajectory.
Key Takeaways
- Bitcoin (BTC) is in a congestion zone at 38/50 Fibonacci levels. The Stochastic indicator suggests a potential move downward if buying momentum continues to fade. A break above the congestion zone could confirm a bullish rebound.
- Ethereum (ETH) has nearly nullified its potential double bottom pattern and is consolidating around its pivot zone (1985-2185). This area is seen as a favorable zone for potential buying, provided external factors do not trigger aggressive price movements.
Technical analysis is based on probabilities, not certainties. Always consider your risk tolerance and seek additional information before making investment decisions.
As always, this article does not constitute financial advice and you should do your own research and consult a professional financial advisor before making any investment decisions.
To keep up to date with all things crypto, such as Xcoins in Facebook and follow us on Twitter, Instagram and LinkedIn.