Bitcoin Price Prediction 2025: Could $150k Be on the Horizon?
Bitcoin continues to captivate the financial world, demonstrating a spectacular end to 2024. With this momentum, many analysts, including us at Xcoins, are seriously considering the possibility of Bitcoin reaching $100,000 in 2024 and potentially surpassing this milestone into 2025. But the critical question remains:
How far can the price go?
To address this, we’ll explore three analytical approaches: technical analysis through the expanding wedge, Fibonacci extensions, and historical patterns following Bitcoin halvings. Each approach provides unique insights into Bitcoin’s price trajectory, culminating in a logical roadmap for its future performance.
1. Measurement of the Expanding Wedge
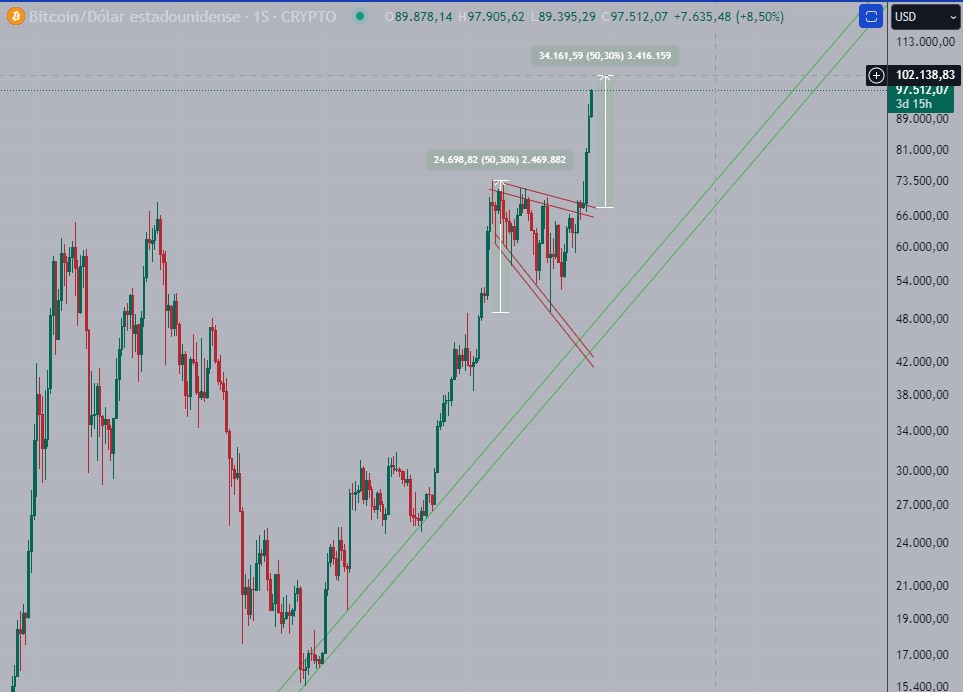
Bitcoin experienced a robust rally in the last quarter of 2023 and the first quarter of 2024. This rally was followed by a period of consolidation in the form of an expanding wedge—a common chart pattern in technical analysis.
Once Bitcoin broke above this wedge, it signaled the continuation of the bullish trend. Here’s what measuring the expanding wedge indicates about Bitcoin’s price:
a. Target Price: According to technical analysis, the breakout from the expanding wedge projects a price target of $102,000.
Source: Trading View, Weekly Graph
b. Psychological Resistance: The round number of $100,000 is likely to serve as a psychological resistance level. Many investors may take profits at this level, triggering a temporary consolidation phase.
In this context, Bitcoin’s ability to surpass $100k and stabilize around this milestone will be pivotal. Consolidation at this level would prepare the asset for further bullish momentum.
2. Fibonacci Extension Based on Trends
The Fibonacci extension tool is a powerful method for predicting price targets during a strong trend. By analyzing the most recent bullish impulse and subsequent consolidation, we can derive two key Fibonacci extension levels:
- Fibonacci Level 1: At $98,000 (97,997.50), this target is almost within reach, serving as an immediate milestone.
- Fibonacci Level 2: The 1.618 extension projects a price of $128,000.
Source: Trading View
This method highlights not only the short-term potential but also the medium-term trajectory. As Bitcoin approaches $98k, traders and investors should watch for signs of sustained momentum that could propel it toward the 1.618 Fibonacci level of $128k.
3. Projection of Bitcoin’s Behavior After Previous Halvings
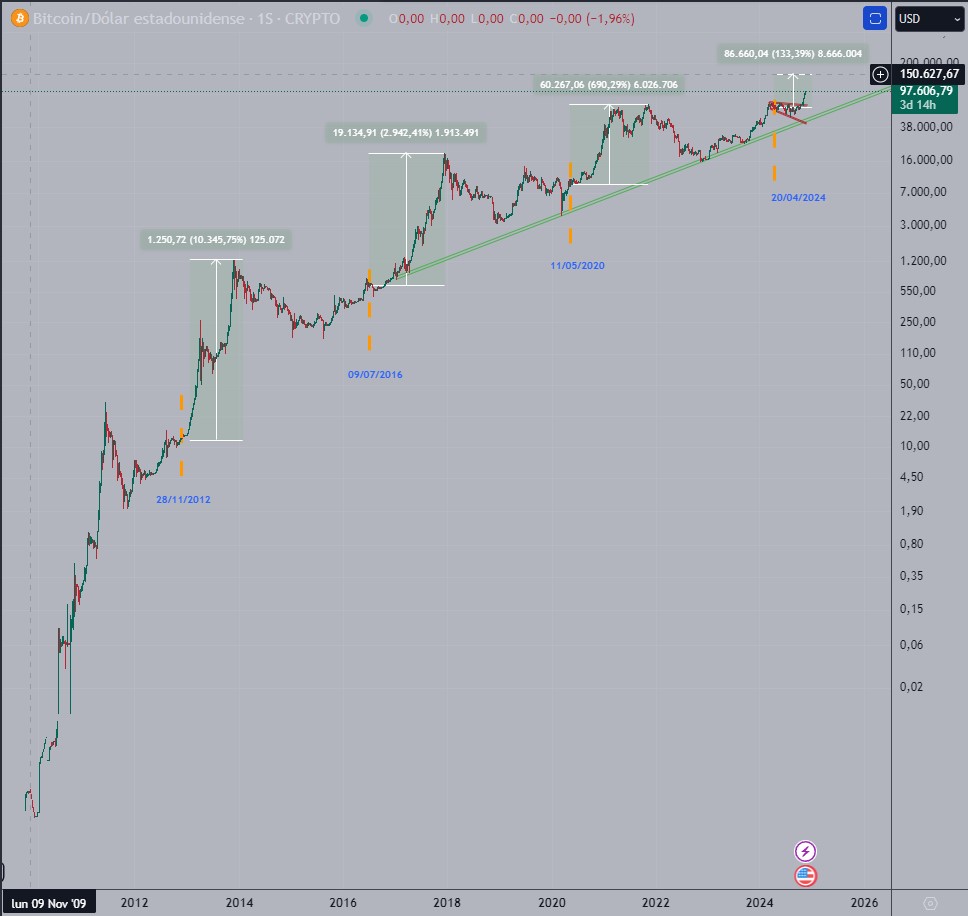
Bitcoin’s halvings have historically been pivotal events that significantly impact its price. By examining its behavior after previous halvings, we can make educated predictions about its future:
Source: Trading View, Weekly Graph
Historical Patterns
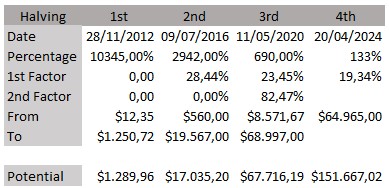
- Calculate Appreciation: After each halving, Bitcoin has demonstrated substantial percentage increases from the halving date to its subsequent peak.
- In 2012, Bitcoin rose approximately 10,000% from $12 to over $1,250.
- In 2016, it increased nearly 2,900%, from $650 to almost $20,000.
- In 2020, the rise was around 690%, from $8,500 to roughly $69,000.
2. Diminishing Returns: While the percentage gains have decreased with each cycle, the absolute dollar increase has continued to grow.
Future Projections
Using the average percentage gain from the last three cycles, Bitcoin’s potential peak following the 2024 halving could reach $150,000. This aligns with both the historical pattern of diminishing percentage gains and the expanding absolute price increases.
Combining the Three Approaches
By integrating the three analytical methods, a comprehensive picture of Bitcoin’s price potential emerges:
- Short-Term Target: $100,000 – $102,000, based on the expanding wedge and Fibonacci Level 1.
- Medium-Term Target: $128,000, as projected by the Fibonacci 1.618 extension.
- Long-Term Target: $150,000, derived from historical patterns following Bitcoin halvings.
It is logical to expect Bitcoin to reach $100k in the very near future, potentially triggering a consolidation phase as investors lock in profits. This consolidation would serve as a launchpad for Bitcoin’s next bullish leg, aiming for $150k.
Conclusion
Bitcoin’s price journey in the coming years is poised to be both exciting and transformative. While $100k is a significant milestone, it is unlikely to be the endpoint. The combination of technical analysis, Fibonacci extensions, and historical halving trends points toward even higher targets, with $150k being a realistic possibility in the long term.
Key Takeaways:
- Bitcoin’s expanding wedge pattern suggests a near-term target of $102k.
- Fibonacci extensions project medium-term levels of $98k and $128k.
- Historical halving behavior supports a long-term target of $150k.
These targets reinforce Bitcoin’s status as a leading asset in the financial markets. However, investors should remain vigilant, as market conditions can shift rapidly.
Don’t miss out on the potential profits during Bitcoin’s rise! Sign up or log in to your Xcoins account today to take advantage of market opportunities and secure your position in the next phase of this crypto journey.
Disclaimer
The information provided in this analysis is for informational and educational purposes only. Technical analysis relies on historical data and probabilities and does not guarantee future performance. Always conduct thorough research and consult a financial advisor before making investment decisions.


