


Bitcoin Price Analysis and Forecast: Navigating Current Trends & Future Scenarios
Quick Takeaways
- Bitcoin has experienced a significant rise since early 2023, entering a consolidation phase in March 2024.
- This consolidation has retraced 38% of the Fibonacci level from the last upward movement.
- Two potential continuation patterns have formed: a flag and an expanding wedge, suggesting a likely upward trend.
- The green scenario predicts Bitcoin’s price reaching between USD 49K and USD 53K.
- The yellow scenario involves a light Fibonacci correction before a potential pattern breakout, though it seems less likely.
- The consolidation phase is viewed as a period for digesting gains, with potential for future upward moves beyond six figures.
Continuing on last week’s analysis of Bitcoin trends, this week we analyse the recent movements. As you know, we come from an explosive rise in Bitcoin’s price since the beginning of 2023. This surge has not only surpassed the highs of late 2022 but has also entered a critical consolidation phase starting in March 2024. This article delves into detailed market analysis summarizing key insights, technical patterns, and potential scenarios for Bitcoin’s price movement from the first week of August 2024.
Current Market Overview
Since October 2023, Bitcoin has been on a clear uptrend, culminating in a significant rise and, afterwards, a consolidation phase that corrected 38% of the Fibonacci level from the last upward movement. Understanding this consolidation is crucial for predicting future price movements.
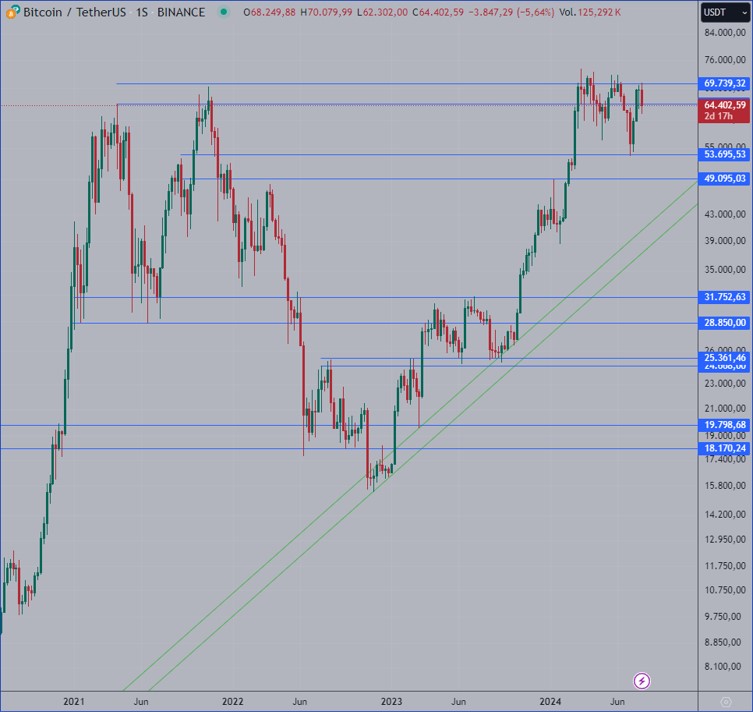
Chart 1: Analysis of the current market overview for Bitcoin
Bitcoin Technical Patterns and Their Implications
The daily chart analysis reveals the formation of two potential patterns:
- A Flag
- An Expanding Wedge
Both patterns are continuation patterns, suggesting a higher probability of the price continuing its upward trend. However, it’s important to note that while these patterns indicate a likely continuation, they do not guarantee it.
Probable Scenarios for Bitcoin’s Price Movement
The analysis presents two potential scenarios for Bitcoin’s price movement:
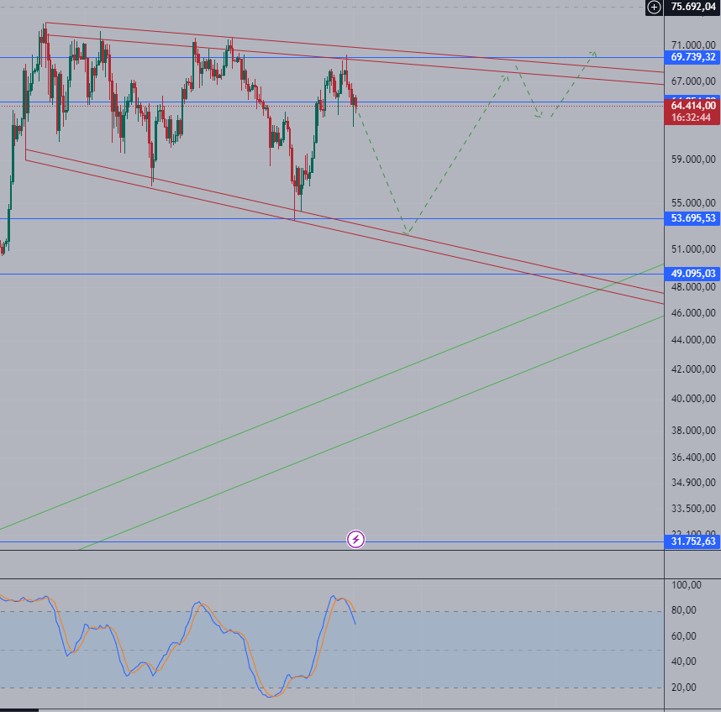
Chart 2: Bitcoin’s Daily Chart – Green Scenario August 2nd 2024
Green Scenario:
- Pattern Behavior: The price continues to move within the bands of the figure.
- Price Target: If this scenario unfolds, Bitcoin’s price is expected to reach between USD 49K and USD 53K and rebound from that point.
- Stochastic Indicator: This scenario aligns with the stochastic indicator, which suggests a correction is needed to clear overbought conditions.
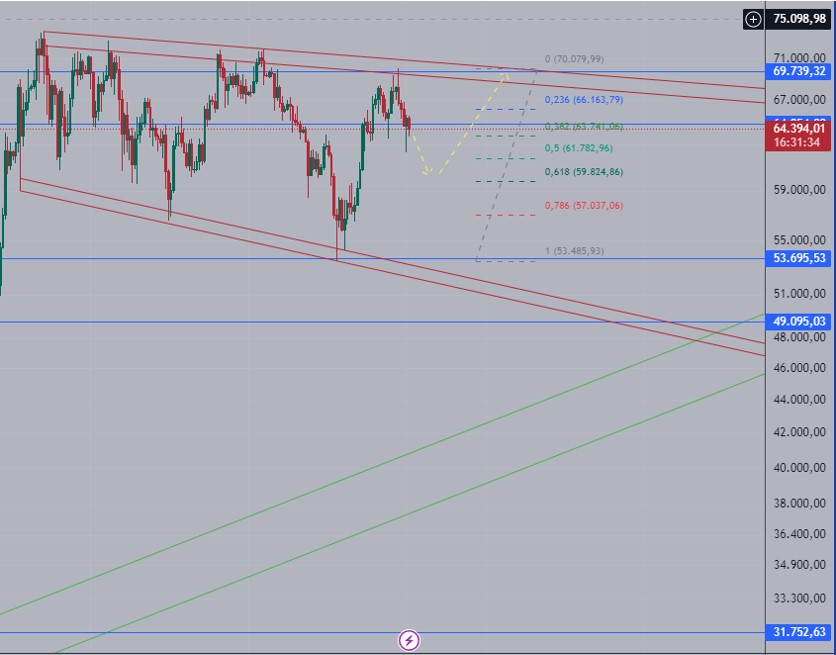
Chart 3: Bitcoin’s Daily Chart – Yellow Scenario
Yellow Scenario
- Fibonacci Retracement: The price corrects between 38% and 61% of the Fibonacci retracement from the previous rise and rebound upwards.
- Pattern Break: Following this correction, the price attempts to break the upper band of the channel.
- Stochastic Indicator: This scenario also considers the overbought conditions indicated by the stochastic indicator but deems this scenario less likely than the green one.
These scenarios reflect the inherent uncertainties in the market, emphasizing the need for traders to remain adaptable and responsive to market developments.
Consolidation Phase: Digesting Gains
The consolidation phase is viewed as a necessary period for the market to digest the significant gains from the past year. This phase is crucial for setting the stage for potential future gains. For those adhering to Elliott Wave Theory, the current phase could represent the development of a macro wave 4, suggesting a forthcoming major upward move that could push Bitcoin’s price above six figures.
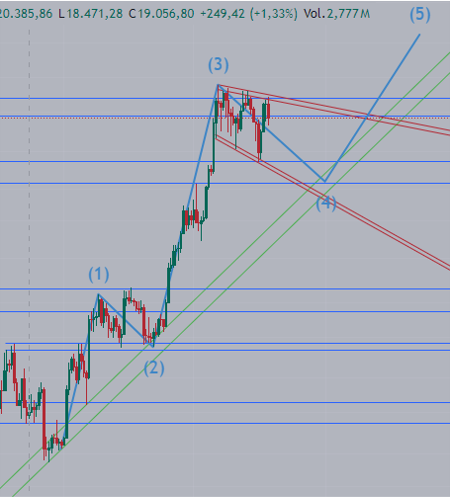
Chart 4 Elliott Wave Theory – Macro Wave 4
Importance of Technical Analysis in Trading
Technical analysis is fundamentally based on probabilities rather than certainties. The insights derived from technical patterns, Fibonacci levels, and stochastic indicators provide traders with probable scenarios, helping them make informed decisions. However, it’s essential to remember that the market can be unpredictable, and flexibility is key.
Conclusion
Bitcoin’s price analysis for 2024 reveals a market in a crucial consolidation phase after an explosive rise. The identified technical patterns and potential scenarios provide a framework for anticipating future price movements. Traders should monitor these developments closely, considering both the green and yellow scenarios while remaining prepared for market fluctuations.
Understanding these dynamics and incorporating them into a broader trading strategy can help navigate the complexities of Bitcoin trading, balancing the probabilities of different outcomes with the inherent uncertainties of the cryptocurrency market.
As always, this article does not constitute financial advice and you should be sure to do your own research and consult a professional financial advisor before making any investment decision.
To stay up to date on all things crypto, like Xcoins on Facebook, and follow us on Twitter, Instagram, and LinkedIn.