Bitcoin: A Return to the Bullish Process? Analyzing the October 2024 Breakout
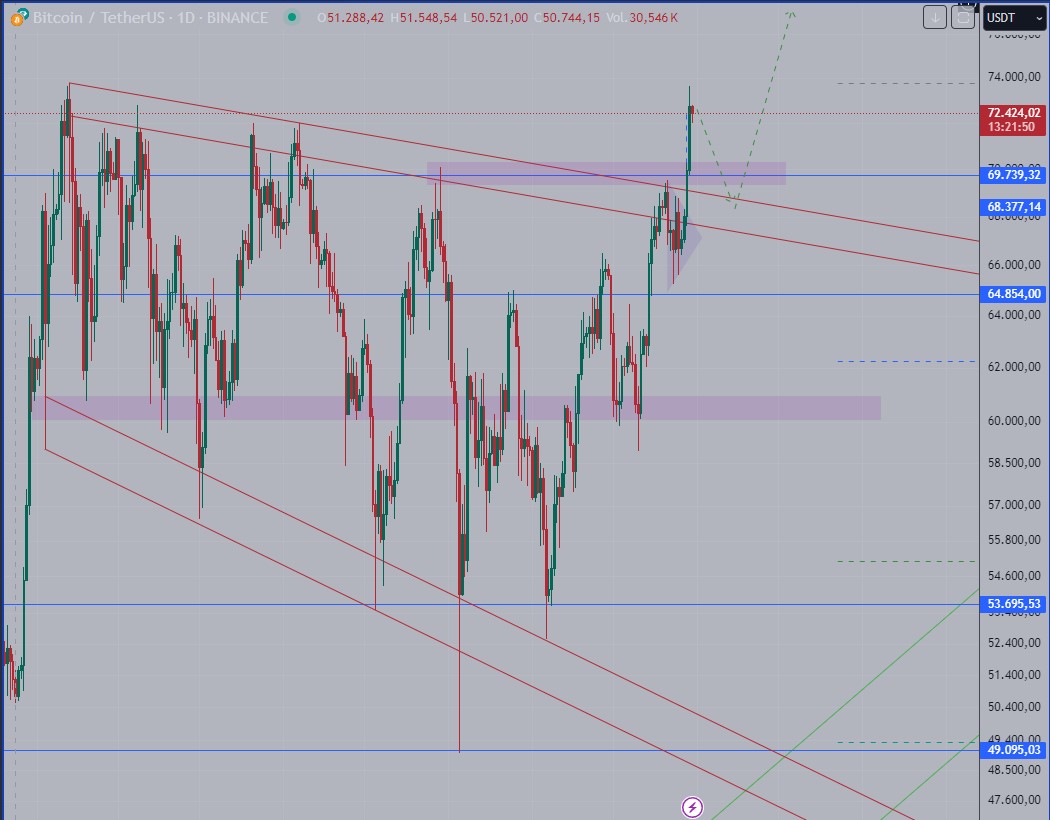
In recent days, Bitcoin (BTC) has displayed remarkable price action that could indicate a return to a bullish trend, raising questions about how far this rally could go. On October 30, 2024, Bitcoin broke out of a broadening wedge, pushing past significant resistance levels, and this technical setup offers a very optimistic outlook. Here, we analyze the current market structure and explore potential future price targets for BTC.
1. Breakout of the Expanding Wedge
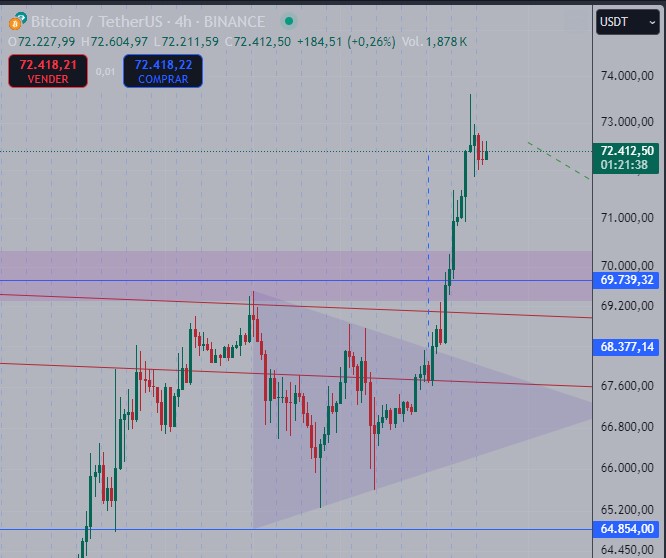
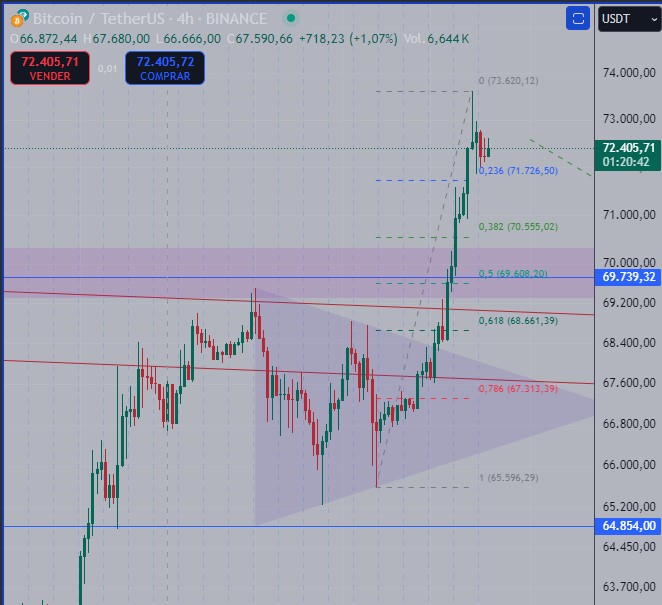
Bitcoin’s recent rally began with a breakout through the upper band of an expanding wedge pattern, which is typically seen as a bullish signal in technical analysis. This breakout was swiftly followed by BTC surpassing recent highs—a clear indication of strength in the market. Before the wedge breakout, Bitcoin formed a smaller symmetrical continuation triangle, a common pattern that suggests consolidation before a further price move. The projected target of this triangle has already been achieved, demonstrating BTC’s current momentum.
2. Short-Term Pullback to Key Support Levels
In the very short term, we should expect a possible pullback, which could bring BTC down to the $70,000 level. This zone is notable for two reasons: it aligns with a 50% Fibonacci retracement, a level often watched by traders for potential support, and it also represents a psychological price point. If BTC does pull back to this level, it could create a new foundation for a subsequent rally and an excellent purchase opportunity.
3. Potential Price Targets Using Fibonacci Projections
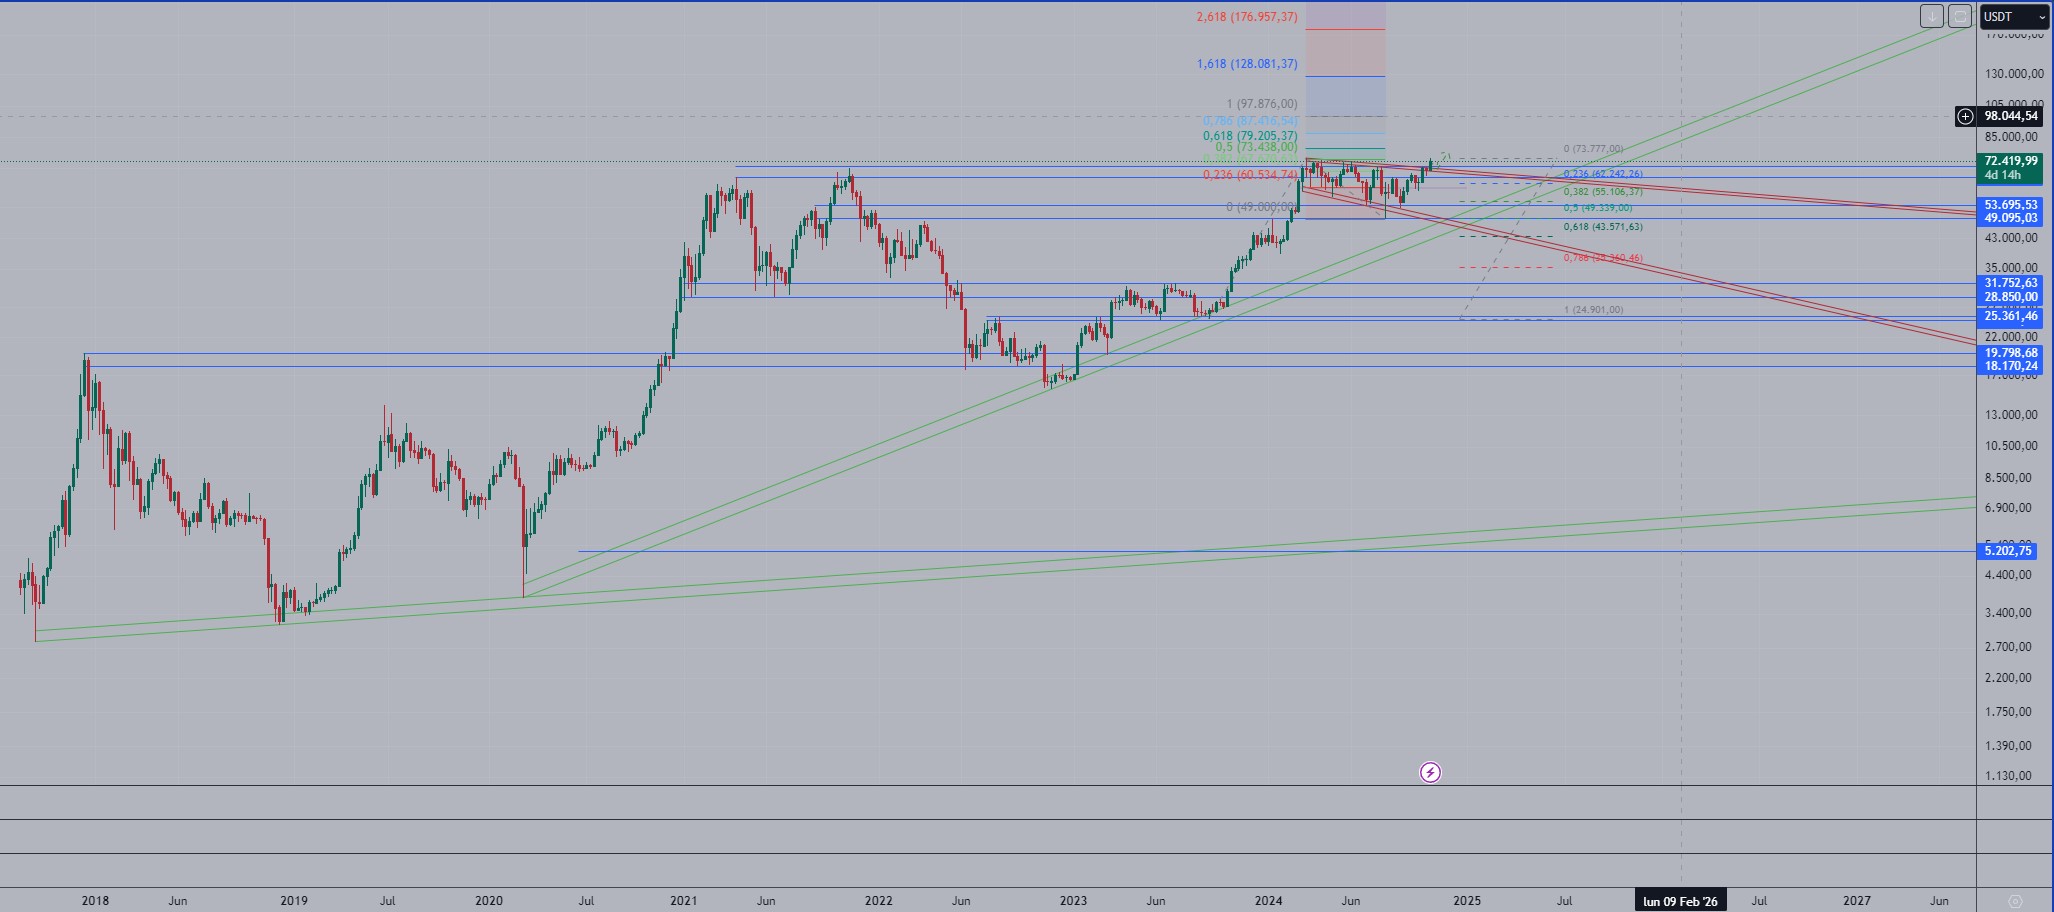
From a technical perspective, once the pullback consolidates, BTC may be poised for a strong upward move. To estimate the potential reach of this next bullish impulse, Fibonacci projections can be employed, taking into account the beginning of the most recent bullish move and the last significant low around $52,000. Based on this analysis, BTC could aim for a primary target near $98,000 in the coming months.
If this bullish trend extends further, a more ambitious target could see BTC pushing toward $130,000. This target aligns with BTC’s historical behavior following past halvings, where the price often enters a prolonged bullish phase, bringing it into the anticipated range between $120,000 and $140,000.
Source: Trading View
4. The Role of the U.S. Election in Market Sentiment
With the U.S. presidential election just days away, BTC may see heightened volatility. Historically, elections have influenced financial markets, and with growing acceptance of cryptocurrencies in mainstream finance, BTC could experience increased demand or selling pressure based on policy expectations. A favorable outcome for the crypto market could act as a catalyst, potentially driving BTC toward the higher end of its projected range.
Conclusion: A Potential Major Bullish Move on the Horizon
After months of consolidation, Bitcoin’s breakout from the expanding wedge and its ability to surpass recent highs are traditionally viewed as bullish signals, suggesting that BTC’s long-term uptrend could be resuming. According to technical analysis theory, price moves following prolonged consolidation often mirror the strength of the consolidation period itself. This suggests that BTC could be on the brink of a significant bullish movement.
While technical analysis is inherently probabilistic and does not guarantee future price movements, the current setup for BTC is notably strong. Given the recent breakout, Fibonacci projections, and market sentiment ahead of the U.S. election, the probability of a continued bullish rally for BTC appears high. If the consolidation phase and recent technical indicators are any guide, BTC’s current trajectory may very well take it toward $98,000, with the potential for even higher levels in the months ahead.
Buy Bitcoin Easily and Securely on Xcoins.com
For those looking to take advantage of this potential Bitcoin rally, buying BTC has never been easier or more secure. At Xcoins.com, users can purchase Bitcoin quickly through a seamless process designed with both beginners and experienced traders in mind. Xcoins.com offers a safe, regulated environment with multiple payment options, ensuring that you can acquire Bitcoin confidently. As Bitcoin shows promising signs of entering a new bullish phase, having access to a reliable platform like Xcoins allows you to stay ahead of market trends and make the most of your crypto investments.
As always, this article does not constitute financial advice and you should be sure to do your own research and consult a professional financial advisor before making any investment decision.
To stay up to date on all things crypto, like Xcoins on Facebook, and follow us on Twitter, Instagram, and LinkedIn.


