


Bitcoin Technical Analysis September 2024: Navigating the Consolidation Phase After a Spectacular Bull Run
The cryptocurrency world is no stranger to volatility, and Bitcoin (BTC) has once again demonstrated its unpredictable nature. Following an impressive bull run in Q4 2023, where Bitcoin surged in value, we now find ourselves in a consolidation phase. This period presents a unique opportunity for investors and traders to evaluate potential future movements of BTC. One key technical pattern currently influencing market sentiment is the formation of an expanding wedge. In this blog, we will explore this technical pattern, the current price action, and potential scenarios for Bitcoin’s future.
Understanding the Expanding Wedge: What Does It Mean for BTC?
An expanding wedge is a technical pattern commonly seen in financial markets. It is characterized by a widening price range, where both the highs and lows of an asset’s price are gradually increasing, creating a “wedge” shape on the chart. In the context of Bitcoin, this pattern has been forming as the cryptocurrency’s price fluctuates between key support and resistance levels. The expanding wedge is typically seen as a consolidation phase following a period of significant price movement—in this case, Bitcoin’s remarkable rise in late 2023.
Key Levels of Confluence: The 49k bullish trend to 53.5k Pivot Zone
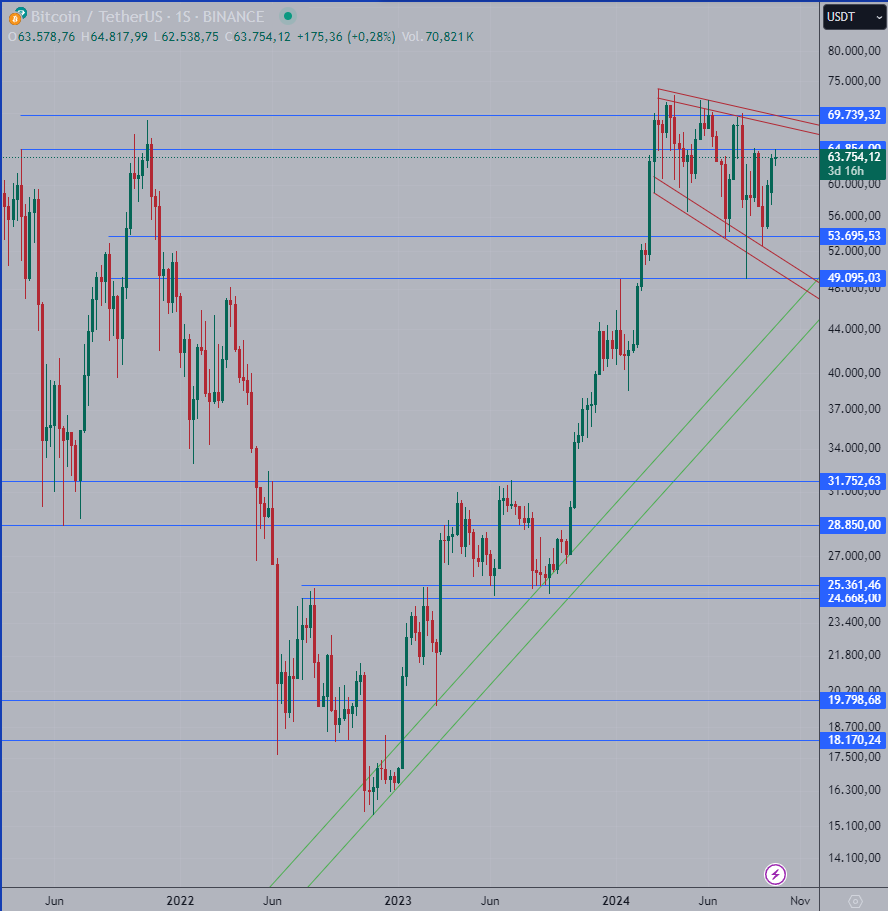
Source: Tradingview, Weekly Graphic
In the recent past, Bitcoin’s price reached a critical zone of confluence, where several technical factors align. This zone, located between 49k and 53.5k, is formed by the lower trendline of the expanding wedge and a significant pivot zone. The importance of this area cannot be understated, as it represents a key support level where Bitcoin has historically found buyers.
When Bitcoin touched this zone, a strong rebound ensued, which brought BTC to its current price levels. This price action underscores the significance of the 49k to 53.5k region in the overall market structure. As Bitcoin continues to trade within the wedge, the next move will likely be determined by how it interacts with these crucial levels.
Current Market Situation: BTC at a Crossroads
At the time of writing, Bitcoin’s price has reached an interesting level, marked by its last significant high. This high, which is clearly highlighted on technical charts, represents a resistance level that Bitcoin must overcome in order to progress. However, as with any technical pattern, there are multiple scenarios that could play out from this point forward.
Scenario 1: The Green Path – A Slight Pullback Followed by a Breakout
One potential scenario is that Bitcoin experiences a slight pullback before attempting to surpass its previous high. This pullback would allow BTC to consolidate and gather momentum for a renewed push higher. If Bitcoin successfully breaks above this resistance level, we could see an extension of the move towards the upper band of the expanding wedge.
Breaking above the wedge would be a highly bullish signal, indicating that Bitcoin has the potential to enter a new phase of price discovery. In this scenario, BTC could continue its uptrend, potentially targeting new all-time highs. Traders and investors watching for a breakout from this pattern would likely interpret it as a strong buy signal, especially if accompanied by increasing volume and momentum.
Scenario 2: The Yellow Path – A Downward Rotation Towards Key Support
Alternatively, Bitcoin could rotate downward from its current position, leading to a retracement towards a key zone of triple confluence. This zone is defined by the lower trendline of the expanding wedge, the pivot area between 49k and 53.5k, and a long-term upward trendline that has been in place since 2020.
This confluence of technical factors creates a highly significant support area for Bitcoin. Should the price retrace to this zone, it could represent an excellent buying opportunity for traders looking to enter the market at lower levels. This support zone is particularly important because it aligns with Bitcoin’s long-term , suggesting that any pullback to this area could be temporary.
Technical Indicators: Overbought Signals and Market Sentiment
Both of these scenarios are supported by technical indicators, particularly the Stochastic oscillator, which is currently showing that Bitcoin is in overbought territory. The Stochastic indicator measures the momentum of an asset and can provide insights into whether an asset is overbought or oversold. When the Stochastic is in overbought territory, it suggests that the asset may be due for a short-term correction before resuming its trend.
In Bitcoin’s case, the overbought signal adds weight to both the green and yellow scenarios. If the green scenario plays out, the short-term pullback would allow Bitcoin to reset its momentum before attempting a breakout. On the other hand, if the yellow scenario occurs, the overbought signal could be a precursor to a more significant retracement towards key support levels.
Conclusion: What’s Next for Bitcoin?
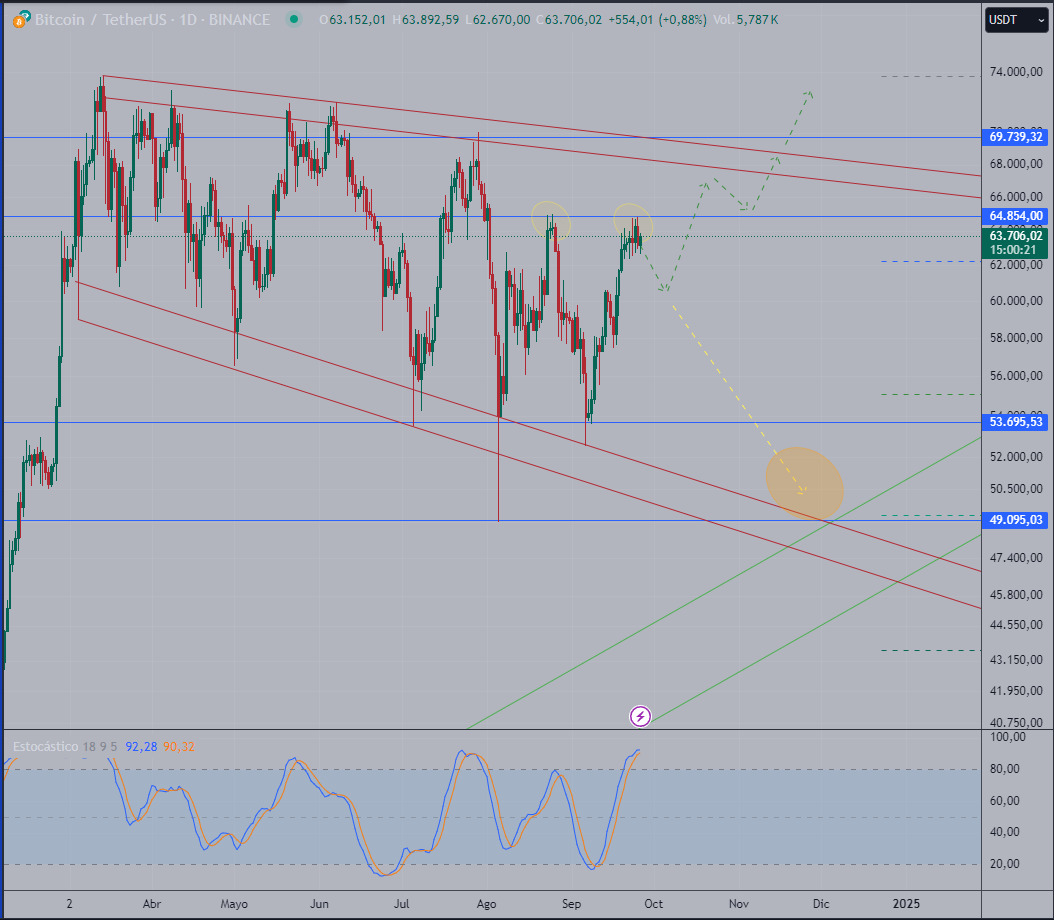
Source: TradingView, Daily Graphic
As we look ahead, Bitcoin’s next move will be crucial in determining the future direction of the market. The expanding wedge pattern provides a clear framework for understanding potential price movements, but it’s important to remember that technical analysis is not an exact science. While the green and yellow scenarios offer two possible outcomes, there is always the possibility that Bitcoin could take an unexpected path.
The Green Scenario: A Bullish Breakout
If the green scenario materializes, and Bitcoin successfully breaks above its previous high, we could see a renewed uptrend and a potential continuation of the bull market. This would likely be accompanied by a surge in buying activity, as traders look to capitalize on the breakout. In this case, Bitcoin could target the upper band of the expanding wedge and possibly new all-time highs.
The Yellow Scenario: A Buying Opportunity at Lower Levels
If the yellow scenario plays out, and Bitcoin retraces towards the 49k to 53.5k confluence zone, this could represent an excellent buying opportunity for those looking to enter the market at a more favorable price. The key support provided by the lower trendline of the expanding wedge and the long-term upward trendline suggests that any pullback could be short-lived, with Bitcoin resuming its uptrend in the long run.
Final Thoughts: Trading Based on Probabilities
As always, it’s important to remember that technical analysis is based on probabilities, not certainties. While the expanding wedge pattern provides valuable insights into potential price movements, there are no guarantees in the world of cryptocurrency trading. Market conditions can change rapidly, and even the most unlikely scenarios can materialize.
For traders and investors, the key is to remain vigilant, manage risk appropriately, and be prepared for any outcome. Whether Bitcoin breaks out to the upside or retraces to lower levels, the expanding wedge pattern offers a roadmap for navigating the next phase of BTC’s journey.
For those looking to take advantage of Bitcoin’s next potential move, Xcoins offers a reliable and user-friendly platform to buy and trade BTC securely. Xcoins provides fast transactions, 24/7 support, and an intuitive interface to help you buy Bitcoin with ease. Take the next step in your investment journey with Xcoins, and get ready for Bitcoin’s future moves!
Disclaimer: This article is for informational purposes only and does not constitute financial advice. Please do your own research and consult with a financial advisor before making any investment decisions.
The narrative around Bitcoin has evolved from a speculative investment to a legitimate store of value, and the increasing discussions around its role in central bank reserves underscore its staying power in the global financial ecosystem.
As we enter a new era of digital innovation in finance, Bitcoin is poised to be a cornerstone of this transformation. For those investing in Bitcoin, the future looks bright as the cryptocurrency continues to prove its value not just as an alternative asset, but as a key player in shaping the financial systems of tomorrow.
As always, this article does not constitute financial advice and you should be sure to do your own research and consult a professional financial advisor before making any investment decision.
To stay up to date on all things crypto, like Xcoins on Facebook, and follow us on Twitter, Instagram, and LinkedIn.